Chemistry Reference
In-Depth Information
As.Figure.9.21.shows,.the.agreement.between.the.experimental.and.theoretical.
PFI-ZEKE.spectrum.is.very.satisfying..Therefore,.the.reliability.of.the.ground-state.
assignment.of.vanadium.trimer.is.proven.by.the.simulation.of.the.experimental.PFI-
ZEKE.spectrum.
9.4.2 n
B
3
o
The.vibrationally.resolved.488.nm.negative.ion.photoelectron.spectrum.of.Nb
3
O.pro-
vides. measurements. of. its. electron. afinity. and. vibrational. frequencies,. which. can.
be. summarized. as. follows.. The. electron. afinity. of. Nb
3
O. is. 1.393.±.0.006.eV. [128]..
The.metal-oxygen.stretching.frequency.is.710.±.15.cm
−1
.for.the.neutral.Nb
3
O.cluster..
Lower.symmetric.modes.are.also.active,.with.frequencies.of.320.±.15.cm
−1
.for.the.neu-
tral.Nb
3
O.and.300.±.20.cm
−1
.for.its.anion..The.Nb
3
O.spectrum.indicates.that.the.extra.
electron.in.the.anionic.system.occupies.essentially.a.nonbonding.orbital.and.that.the.
neutral.and.anionic.clusters.have.very.similar.structures..We.have.presented.compu-
tational.results.for.structural.and.spectroscopic.properties.of.both.neutral.and.anionic.
niobium.trimer.monoxides.[185]..We.used.DFT.calculations.in.combination.with.scalar.
quasirelativistic.ECPs..In.order.to.test.the.accuracy.of.the.used.ECPs.in.the.framework.
of. the. Kohn-Sham. method,. the. PFI-ZEKE. spectrum. of. Nb
3
O. [108]. was. simulated.
from. the. harmonic. vibrational. frequencies. of. the. neutral. and. cationic. ground-state.
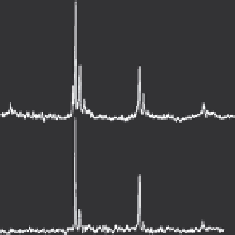
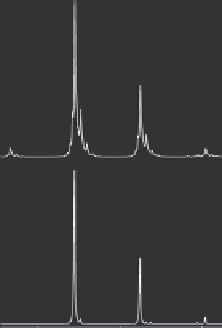
structures.and.the.corresponding.normal.mode.vectors..Figure.9.22.shows.the.com-
parison.between.the.experimental.PFI-ZEKE.spectrum.(a).recorded.at.300.K.(top).and.
at.100.K.(bottom).and.the.corresponding.spectra.obtained.by.our.simulation.(b).
As.Figure.9.22.shows,.the.agreement.between.the.experimental.and.theoretical.
PFI-ZEKE.is.very.satisfying..Moreover,.we.notice.that.our.simulated.spectra.are.in.
better.agreement.with.the.experimental.ones.than.the.simulated.spectra.reported.in.
300 K
0
300 K
0΄
0˝
1
1΄
b
a
2
c
100 K
100 K
44,400
44,800
45,200
44,400
44,800
45,200
(a)
Energy (cm
−1
)
Energy (cm
−1
)
(b)
FIGURE 9.22
Experimental. (a). and. simulated. (b). PFI-ZEKE. spectra. of. Nb
3
O. at. 300. and.
100.K..The.position.of.the.0-0.band.has.been.shifted.to.the.experimental.value.of.44,578.cm
−1
..
(Reprinted. from. Calaminici,. P.. et. al.,.
J. Chem. Phys
.,. 121(8),. August. 22,. 3558,. 2004.. With.
permission.)
Search WWH ::

Custom Search