Chemistry Reference
In-Depth Information
45
40
35
30
25
20
15
10
5
0
-200
-100 0
φ(O5-C1-O1-C7)/degrees
100
200
(A)
45
40
35
30
25
20
15
10
5
-200
-100 0
φ(O5-C1-O1-C7)/degrees
100
200
(B)
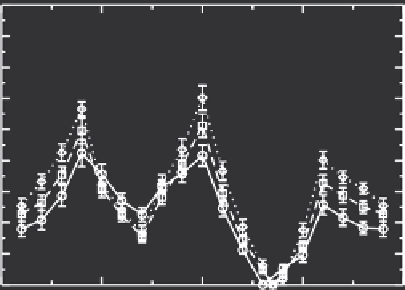
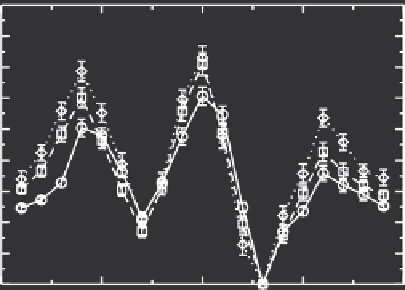
FIGURE 3.6
Calculated. torsional. energy. change. of. the. glycosidic. linkage. of. methyl-α-
mannopyranoside.(solid.line).and.its.energy.change.in.the.vicinity.of.one.(dashed.line).and.
two.Fe
3+
.ions.(dotted.line).in.water,.with.the.PMF.method:.(A).CPMD.simulations,.(B).CMD.
simulations.. The.inset. plot.(B).presents. the.calculated.energy. differences. of.the.glycosidic.
linkage. of. methyl-α-mannopyranoside. with. the. perturbation. and. PMF. methods. by. CMD.
simulations..Errors.were.calculated.using.the.time-dependent.standard.deviation.method.
of.the.glycosidic.linkage.and.predict.+60°.as.the.minimum.for.M,.M-Fe
3+
,.and.in.
water..For.the.gas.phase,.this.trend.is.
g+ > t ≈ g
−.as.reported.above.and.indicates.
that.water.stabilizes.the.
g
−.orientation.of.the.glycosidic.linkage.over.its.
t
.orientation.
upon.coordination.of.Fe.
According.to.the.CPMD.simulations,.the.average.intramolecular.hydrogen.bond-
ing. distances. O2-O3,. O3-O4,. and. O4-O6. of. M. in. water. vary. between. 2.1. and.
4.5.Å..In.contrast,.CMD.simulations.predict.that.these.intramolecular.distances.are.
between. 2.4. and. 3.7. Å.. The. intramolecular. hydrogen. bonds. between. O2. and. the.
H. attached. to. O3. are. shorter. than. those. for. O3-O4. and. O4-O6. according. to. the.
CPMD.simulations.(Table.3.4)..Furthermore,.the.predicted.intermolecular.hydrogen.
bonds.between.O2-water,.O3-water,.and.O4-water.indicate.a.stronger.coordination.
Search WWH ::

Custom Search