Information Technology Reference
In-Depth Information
rDNA probe labelled four sites on the short arms of two submetacentric chromosomes and
one locus was labelled with 5S rDNA probe [4]. The species differed in the physical
position of this 5S rDNA locus. The NOR activity analysed by Ag-staining in metaphase
cells also showed differences between the species.
AFLPs analysis revealed that there is no genetic differentiation between
Silene longicilia
ssp.
longicilia
and
S.
longicilia
ssp.
cintrana
. The data showed a high degree of genetic diversity although lacking population
structure (Fig.2A and B), indicating gene flow and a panmictic population. Neither morphological nor genetic
discontinuities were detected within the species, thus indicating that both named entities correspond to
S.
longicilia
, with no reason for the maintenance of the subspecific rank
The study of
S. rothmaleri
, one of the rare species of the group, revealed a non-
specific micro-habitat coloniser [5]. The species presence in its habitat was related to the
availability of the micro-habitat (deposits, step, fissure, scree) on the southwestern
Portuguese coast either in sea cliff or mountain
facies
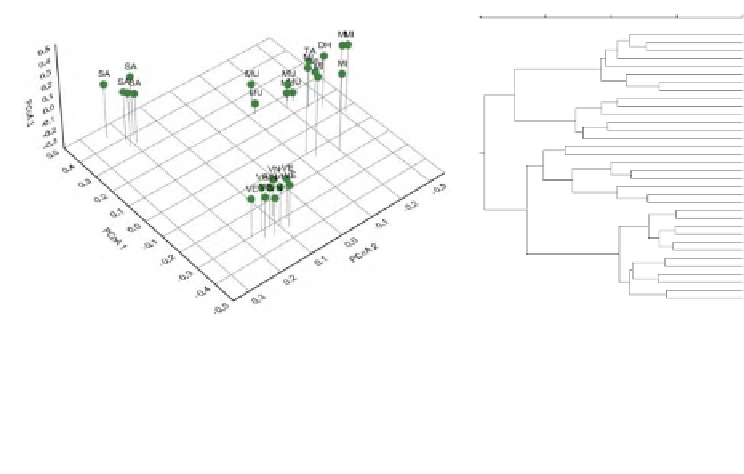
. The species analysed with RAPD
displayed a high degree of genetic diversity mainly distributed within populations rather
than between populations and a considerable degree of differentiation with population-
specific markers [6] as depicted in Fig. 3.
Conservation implications and future prospects of this work include the need for
revision of the conservation status of
S. longicilia
, the study of the rare
taxa
belonging to
S.
rosulata
from North Africa, the evaluation of the relationships between
S. coutinhoi
and
S.
mellifera
and a better understanding of genetic variability in
S. nutans
and
S. italica
.
1.0
0.6
0.7
0.8
0.9
SA1
SA3
SA13
SA6
SA14
SA22
SA24
SA2
MU52
MU5
MU5
MU6
DH70
TA 7 1
MI37
MI38
MI39
MI40
MI41
MI42
VN27
VN28
VN29
VN35
VN34
VN36
VN72
VN73
VN74
VN75
VN76
VN77
MU54
MU7
Figure 3-
A:
PCoA of 34 plants of
Silene rothmaleri
. Axis 1 represents 25% of the
variance, axis 2 (12%) and axis 3 (8%).
B
: PCoA of 34 plants of
Silene rothmaleri
.
Axis 1 represents 25% of the variance, axis 2 (12%) and axis 3 (8%). cf.[6] for
details.