Geoscience Reference
In-Depth Information
179
180
179-181
Concrete samples with W/Cs in the low
(<0.35), normal (0.35-0.65), and high (>0.65) ranges
for
179
,
180
, and
181
respectively. Using
fluorescence microscopy the microporosity of the
cement paste appears low (
179
, dark green), normal
(
180
, light green), and high (
181
, yellow). Fine
aggregate particles appear black; UV, ×150.
181
182
183
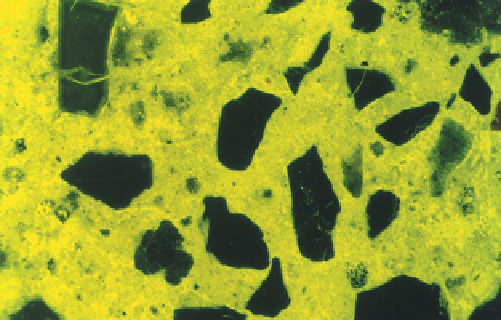
182
Concrete with variable microporosity of the
cement matrix ranging from normal (light green) to
high (yellow). Overall W/C is difficult to determine
but is probably in the normal range (0.35-0.65); UV,
×150.
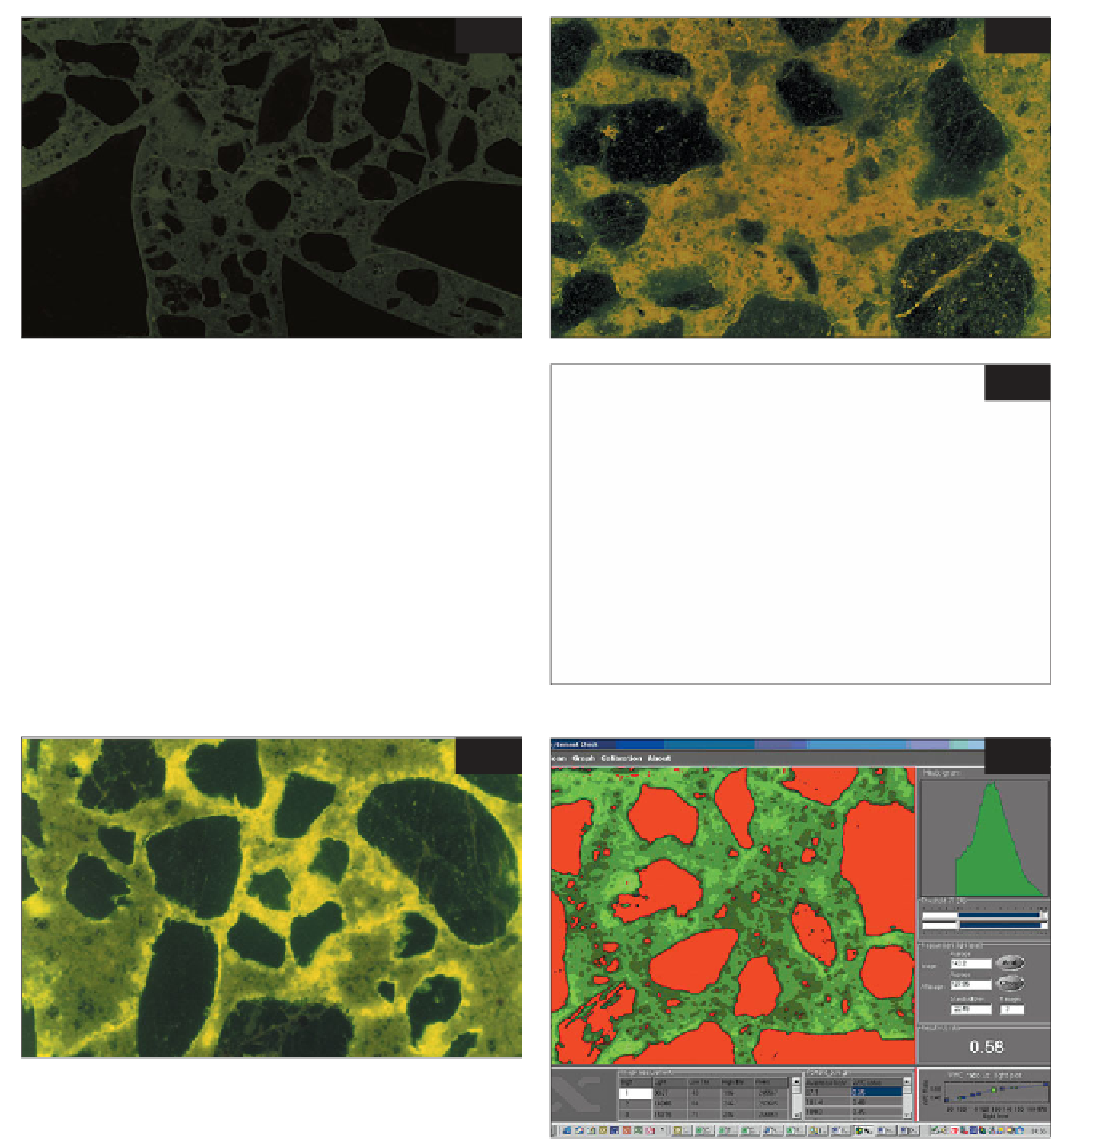
183
A user interface of W/C-CHECK software for
automatic determination of W/C of concrete thin
section specimens, showing a colour segmented
image, intensity histogram, calibration curve, and
analysis data. (Courtesy of Concrete Experts
International.)