Database Reference
In-Depth Information
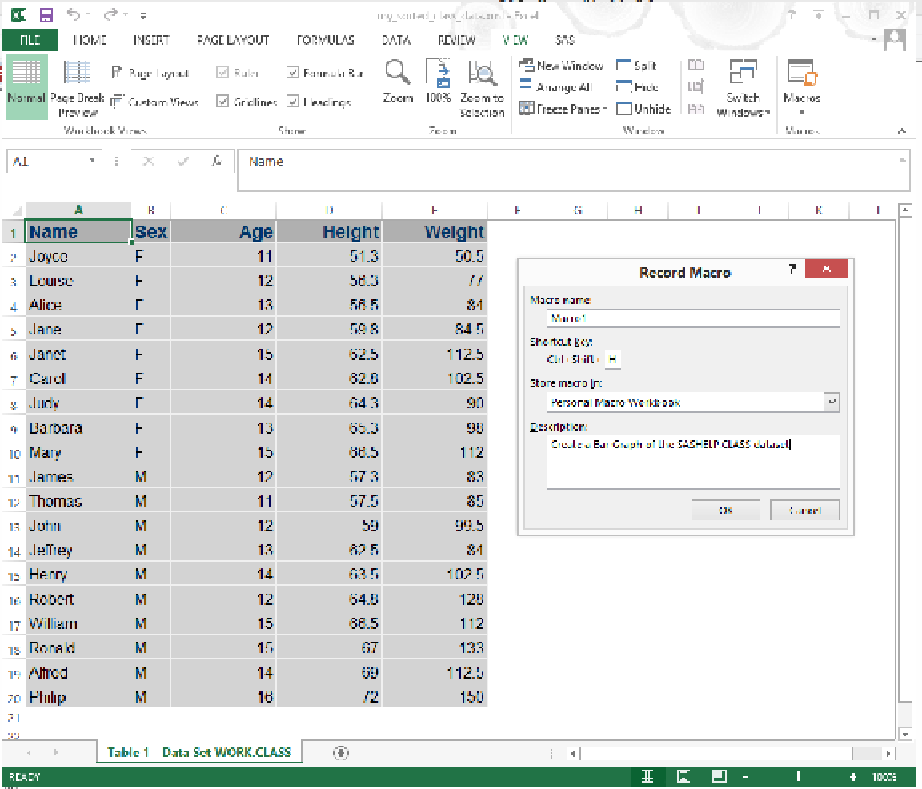
Figure 13.3.8: The Record Macro Excel Window.
Figure 13.3.8 shows the macro name as being Macro1. We will see how to change that a little later. Once
you press the “OK” button, the recording of your actions will start. We want the macro to do the following
things.
●
Select all of the data cells and adjust the column widths so that each is the minimum size.
●
Select all of the data fields and create a 3-dimensional column chart.
●
Change the location of the chart to be near the top right of the screen.
●
Widen the Excel window.
•
Scale the graph so that legends are clear. Sometimes the graph will not scale correctly the first
time you execute the code. However, the second time you execute the macro it may appear better
because the Excel window was updated when the macro ran the first time.
The graph produced in Figure 13.3.9 was produced by the Excel macro shown in Figure 13.3.10a.
The Macro Library Tool executed the code to produce the graph before the SAS program finished running.
When the SAS options XWAIT and XSYNC are active, the SAS programs wait for the Windows command
window to finish executing before returning control to SAS.
Search WWH ::

Custom Search