Database Reference
In-Depth Information
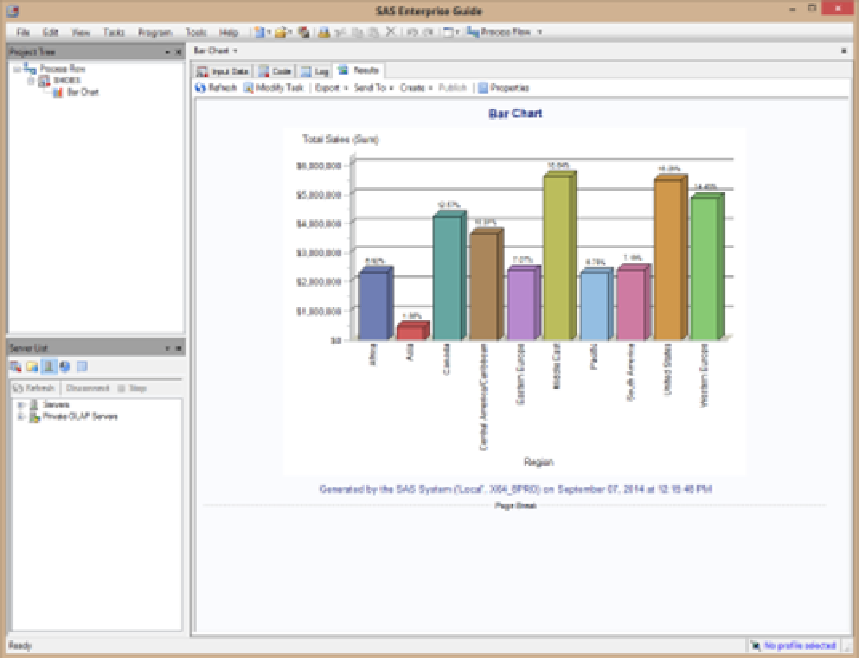
Figure 7.9: An Enterprise Guide Bar Chart of the Shoes Dataset Showing Total Sales by
Region.
Step 2: Export the bar chart as a *.srx file from using SAS Enterprise Guide.
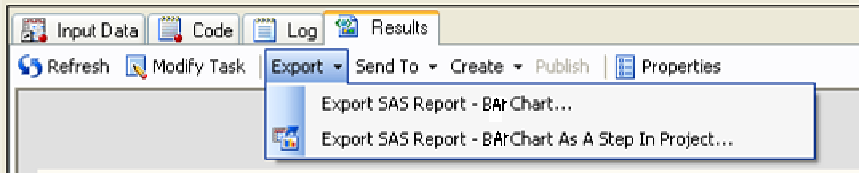
Next, we need to create the *.srx file by using the “EXPORT” feature of SAS Enterprise Guide. Figure
7.10 shows an expanded view of the Export tab on the Project toolbar with the two options.
Figure 7.10: Expanded Area of Figure 7.9 Showing the Export Tab Options from SAS
Enterprise Guide.
Either option will create a *srx file. The first option will output the displayed bar chart directly into a
directory you choose. The output will be a *.srx file and a directory that contains a cascading style sheet.
This option will place the information into the directory when you press Save. Figure 7.11 appears when
you select “Export SAS Report - Bar Chart”. The message that appears when other charts or graphs are
exported may be different from this message. Figure 7.11 also shows that no other *.srx files exist in the
same directory; that may not always be the case.
Search WWH ::

Custom Search