Information Technology Reference
In-Depth Information
regime probability − online − low − 1189tac4
regime probability − online − mid − 1189tac4
regime probability − online − high − 1189tac4
1
1
1
O
B
S
O
S
O
B
S
0.8
0.8
0.8
0.6
0.6
0.6
0.4
0.4
0.4
0.2
0.2
0.2
0
0
0
0
20
40
60
80
100
120
140
160
180
200
220
0
20
40
60
80
100
120
140
160
180
200
220
0
20
40
60
80
100
120
140
160
180
200
220
Time in Days
Time in Days
Time in Days
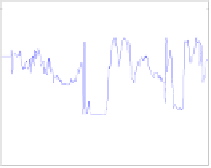
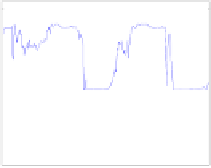
Fig. 9.
Game 1189@tac4 (Final TAC SCM 04) - Regime probabilities over time computed online
every day for the low (left), medium (middle) and high (right) market segment
Entropy(Regimes) − low − 1189tac4
Entropy(Regimes) − mid − 1189tac4
Entropy(Regimes) − high − 1189tac4
1.5
1.5
1.5
1
1
1
0.5
0.5
0.5
0
0
0
0
50
100
150
200
0
50
100
150
200
0
50
100
150
200
Days
Days
Days
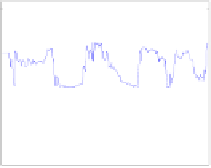
Fig. 10.
Game 1189@tac4 (Final TAC SCM 04) - Daily entropy values of the three regimes for
the low (left), medium (middle), and high (right) market segment
A measure of the confidence in the regime identification is the entropy of the set
S
of
probabilities of the regimes given the normalized mid-range price from the daily price
reports np
day
,where
S
=
{
P
(
R
1
|
np
day
)
,
···
,P
(
R
M
|
np
day
)
}
and
k
=1
−
M
Entropy(
S
)
≡
P
(
R
k
|
np
day
)log
2
P
(
R
k
|
np
day
)
.
(6)
An entropy value close to zero corresponds to a high confidence in the current regime
and an entropy value close to its maximum, i.e. for M regimes log
2
M
, indicates that
the current market situation is a mixture of
M
almost equally likely regimes. Examples
for the three market segments in game 1189@tac4 are shown in Figure 10.
5
Regime Prediction
The behavior of an agent should depend on the current market regime as well as expec-
tation of future regimes. This requires a way for the agent to predict future regimes and
when regime switches will occur.
We model regime prediction as a Markov process. We construct a Markov transition
matrix,
T
predict
(
r
t
+1
|
r
t
) off-line by a counting process over past games. This matrix