Information Technology Reference
In-Depth Information
FreeAgent
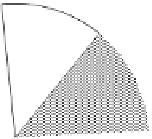
13%
Mr. UMBC
13%
Unfilled
39%
UMTac-04
13%
Botticelli
4%
Deep Maize
8%
Southampton
10%
Fig. 4.
Market share in the SCM finals
components suggests that
Deep Maize
was probably too selective about prices for
certain key components.
A final point about inventory management is that
FreeAgent
had a substantially
lower average daily inventory than the next two agents, despite comparable overall
quantities purchased. This appears to be the result of ordering non-CPU inventory over
many days, which allowed the agent to divide quantities into more requests and dis-
tribute them move evenly over time. This gave
FreeAgent
some advantage in storage
costs over these two agents, and helped to offset the higher prices paid by the agent for
non-CPU components.
4
Agent Sales Behavior
4.1
Basic Sales Data
We now attend to activity in the PC sales market, starting with overall market share
in Figure 4 (raw sales numbers are listed in Table 5). Market shares mostly parallel
the total quantities of components ordered, as given in Table 3. The major exception is
SouthamptonSCM
, which purchased similar quantities to the top three agents but took
a much smaller share of the customer market. This reflects the large amount of unsold
inventory for this agent noted in the previous section. We also note that almost 40% of
the total customer demand was unmet. Some of this is unavoidable since agents must
build inventory at the start of the game before they can sell PCs. However, there does
seem to be significant opportunity for agents to expand market share by filling unmet
demand.
More detailed information on sales activity is given in Table 5. The top three agents
sold very nearly the same number of PCs, and won an almost identical fraction of
their bids. However, they had strikingly different average selling prices (ASPs). This
difference in ASPs is one of the major reasons that the three agents finished in the order