Environmental Engineering Reference
In-Depth Information
over the extended time, the control (untilled) populations also increased and
maintained cell numbers effectively.
Within the microbial biomass, there was no correlation to PAH concen-
tration for Gram-positive bacteria, but there was for Gram-negative bacteria.
As total PAH concentrations declined, Gram-negative bacterial percentages
increased. This observation was consistent for both LTUs (r of -0.86 and
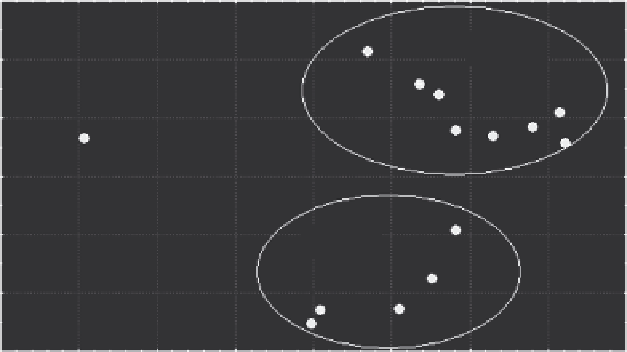
-0.66 for LTUs 1 and 2, respectively). The LTU microbiota showed signs of
divergence, identified by hierarchical cluster analysis, from 3 months
onward. The evolution continued during phase 2. By 22 months, the LTUs
demonstrated different community structures (Figure 7.27). A Gram-nega-
tive community of mostly
Pseudomonas
sp. and a Gram-positive community
primarily of
Bacillus
sp. predominated in both LTUs at 22 months. Several
PLFAs were found to differ significantly between the two LTUs. Within the
Gram-negative classification, several PLFAs were identified that are indica-
tive of
Pseudomonas
sp. Two of the distinctive PLFAs were trans acids, which
have been shown to increase in prevalence inside the bacterial membrane
in response to toxic exposures (Heipieper et al., 1995). The ratio of trans to
cis (product to parent) suggests an increasing bacterial response by the
indigenous bacteria to the presence of the xenobiotics in the soil. As dis-
cussed previously, many of the pseudomonads are capable of producing
surfactants that may desorb PAHs from the soil particles, making them
available for biodegradation as well as increasing their chemical extractabil-
ity. An increase in the bioavailability of the toxicant would also induce an
increase in the trans/cis ratio, suggestive of surfactant production. If PAH
desorption from the soil exceeded the biodegradative capacity of the micro-
bial population, the contaminant transformation could be slowed, or
0.06
LTU_2F
LTU-2
0.04
LTU_2P
LTU_2E
LTU_2J
LTU_2L
LTU_2N
LTU_2M
LT U _ 1 N
0.02
LTU_1P
0.00
LT U _ 1 J
−0.02
LTU-1
LTU_1M
−
0.04
LTU_1L
LTU_1F
LTU_1E
−
0.06
0.996
0.997
0.997
0.998
0.998
0.999
0.999
1.000
1.000
Figure 7.27
Final community composition in the LTUs by hierarchical cluster analysis.