Environmental Engineering Reference
In-Depth Information
~22 Months Post-Flush
~25 Months Post-Flush
C7
C7
C3
C4
C3
C4
MW-512
MW-512
MW-514
MW-513
MW-514
MW-513
C2
80000 ug/L
MW-505
C2
MW-505
C1
C1
70000 ug/L
MW-506
MW-506
MW-509
MW-510
MW-511
MW-509
MW-510
MW-511
60000 ug/L
MW-507
MW-507
50000 ug/L
40000 ug/L
~28 Months Post-Flush
~31 Months Post-Flush
30000 ug/L
20000 ug/L
10000 ug/L
C7
C7
0 ug/L
C3
C4
C3
C4
MW-512
MW-512
MW-514
MW-513
MW-514
MW-513
C2
MW-505
C2
MW-505
C1
C1
MW-506
MW-506
MW-509
MW-510
MW-511
MW-509
MW-510
MW-511
MW-507
MW-507
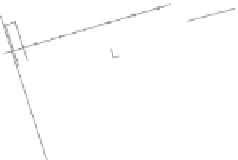
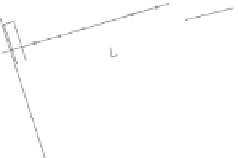
Figure 5.17
PCE contour plots over the groundwater monitoring period (80,000
μg/l = 480 μ
M
).
of ethylene show a consistent trend of formation in the same wells that
showed relatively high ethanol concentrations over time (MW-505, MW-509,
C1 to C3, RW-3, and RW-7). The contour plots for this data indicate the area
of main activity is from the injection/extraction area downgradient to well
C2 (Figure 5.27 to Figure 5.29).
The formation of the daughter products of PCE is an indication that
in
situ
reductive dechlorination is beginning to occur. The process appears to
have begun initially in the area where the cosolvent extraction was con-
ducted and later in locations downgradient of the targeted source area.
Production of chloride is concomitant with the reductive dechlorination
of PCE, and because it is a relatively nonreactive anion, one would expect
to see an increase in chloride concentrations over time. Background chloride
concentration was less than 10 mg/l except in the injection/extraction zone,
where concentrations were as high as 20 mg/l. Overall, there was a trend
of increasing chloride concentrations over time (Figure 5.30). In particular,
monitoring wells that showed the formation of cis-DCE also had an increase
in chloride concentrations. Data from the RWs did not show this relationship
and had more variable concentrations of both cis-DCE and chloride. Contour
plots of chloride do show an increase in concentrations in the area immedi-
ately downgradient of the injection/extraction zone within 1 month of the
cosolvent flushing test (Figure 5.31 to Figure 5.33). After approximately 1
year, this area of higher chloride concentrations appears to have moved
farther downgradient to the area of C1 and C2.
The maximum measured chloride concentration was approximately 2
m
M
, which is almost four times the maximum measured PCE concentration
of 500 μ
M
. This compares well to the complete dechlorination of PCE, which


