Civil Engineering Reference
In-Depth Information
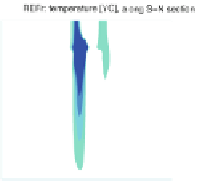
Fig. 5.3 12-turbine OWF effect (OWFr-REFr) on hydrographic conditions after 24 h operating
wind turbines, be aware of different colorbars. The effect is presented for (a1)-(a3) temperature,
(b1-b3) salinity, (c1-c3) density in the horizontal at surface (a1-c1) and along W-E (a2-c2) and
S-N (a3-c3) cross sections through the OWF, which are marked with
solid lines
in the first
domain. Thermocline is defined in 12-m depths (
dotted line
in a2/a3-c2/c3), and the OWF is
placed in the middle of the model domain around
x
¼
y
¼
0
impact on the ecosystem. Beforehand, these vertical cells were durable, which will
be discussed later under Sect.
5.3
.
Besides hydrodynamic changes, the
hydrographic parameters
are affected too.
Figure
5.3
summarizes results of
temperature, salinity, and density
after 24 h
operating wind turbines, be aware of different colorbars. At surface, these variables
depict the wind field.
Here, an increased sea surface temperature (SST) in the wake zone of 0.2
Cis
recorded. The increase is adhered with a subsidence of surface elevation in the
reference run, which results in little cooler reference SST compared to OWF run.
The northern flank area is about 0.06
C cooler, while in the southern flank area,
where the main upwelling cell is located, a stronger decrease of 0.2
C appears.
Respectively, in those areas, the ocean becomes more/less salty with extreme
changes of 1-2
10
3
psu. Therefore, the wake area becomes less dense with


Search WWH ::

Custom Search