Civil Engineering Reference
In-Depth Information
a
1) # Turbine: 012 , affected grids: 0
4
a2) OWFr: T012, uv10 [m/s]
a3
) OWFr: T012, uv10 [m/s], SW−NE
a4
) OWFr: T012, uv10 [m/s], NW−SE
120
7.00
8
8
8
8
NW
N
max: 6.14
S
W
max: 6.59
NW
105
6.50
min: 2.03
min: 2.01
90
6.00
75
NE
SE
5000
60
5
.50
6
6
6
6
NE
45
5.00
30
4.50
15
0
0
4
.00
4
4
4
4
W
E
−15
3.50
−30
S
W
3.00
−45
−60
2.50
2
2
2
2
−5000
−75
2.00
min: 1.72
max: 6.62
−90
3x3km
−105
1.50
SE
S
−120
1.00
0
0
0
0
−5000
0
5000
−120 −90 −60 −30 0 30 60 90 120
x (km)
−120 −90 −60 −30 0 30 60 90 120
x (km)
−120 −90 −60 −30 0 30 60 90 120
y (km)
x (m)
b
1) # Turbine: 048 , affected grids: 0
4
b2) OWFr: T048, uv10 [m/s]
b3
) OWFr: T048, uv10 [m/s], SW−NE
b4
) OWFr: T048, uv10 [m/s], NW−SE
120
7
.00
8
8
8
8
N
NW
max: 6.15
S
W
max: 6.60
NW
105
6
.50
min: 2.08
min: 1.97
90
6.00
75
NE
SE
5000
60
5.50
6
6
6
6
NE
45
5
.00
30
4.50
15
0
0
4.00
4
4
4
4
W
E
−15
3.50
−30
3.00
−45
S
W
−60
2.50
2
2
2
2
−5000
−75
2.00
min: 1.72
max: 6.60
−90
3x3km
1.50
−105
SE
S
−120
1.00
0
0
0
0
−5000
0
5000
−120 −90 −60 −30 0 30 60 90 120
x (km)
−120 −90 −60 −30 0 30 60 90 120
x (km)
−120 −90 −60 −30 0 30 60 90 120
y (km)
x (m)
c
1) # Turbine: 080 , affected grids: 1
6
c2) OWFr: T080, uv10 [m/s]
c3)
OWFr: T080, uv10 [m/s], SW−NE
c4)
OWFr: T080, uv10 [m/s], NW−SE
120
7
.00
8
8
8
8
N
NW
max: 5.76
S
W
max: 6.21
N
W
105
10000
6.50
min: 2.14
min: 2.41
90
6.00
75
NE
SE
60
5.50
6
6
6
6
NE
5000
45
5.00
30
4.50
15
0
0
4.00
4
4
4
4
W
E
−15
3.50
−30
3
.00
−45
SW
−5000
−60
2.50
2
2
2
2
3x3km
−75
2.00
min: 1.93
max: 6.24
−90
−10000
1
.50
−105
S
SE
−120
1.00
0
0
0
0
−10000
−5000
0
5000
10000
−120 −90 −60 −30 0 30 60 90 120
x (km)
−120 −90 −60 −30 0 30 60 90 120
x (km)
−120 −90 −60 −30 0 30 60 90 120
y (km)
x (m)
d
1) # Turbine: 160 , affected grids: 3
2
d2) OWFr: T160, uv10 [m/s]
d3)
OWFr: T160, uv10 [m/s], SW−NE
d4)
OWFr: T160, uv10 [m/s], NW−SE
120
7.00
8
8
8
8
N
NW
max: 5.94
S
W
max: 6.58
N
W
105
10000
6.50
min: 1.28
min: 1.27
90
6.00
75
NE
SE
60
5.50
6
6
6
6
NE
5000
45
5.00
30
4.50
15
0
0
4
.00
4
4
4
4
W
E
−15
3.50
−30
SW
3.00
−45
−5000
−60
2
.50
2
2
2
2
3x3km
−75
2.00
min: 1.21
max: 6.58
−90
−10000
−105
1.50
SE
S
−120
1.00
0
0
0
0
−10000
−5000
0
5000
10000
−120 −90 −60 −30 0 30 60 90 120
x (km)
−120 −90 −60 −30 0 30 60 90 120
x (km)
−120 −90 −60 −30 0 30 60 90 120
y (km)
x (m)
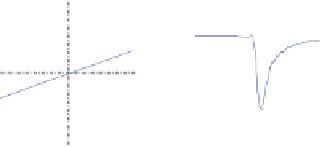
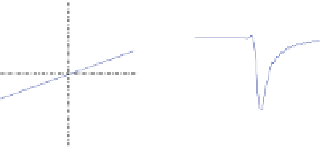
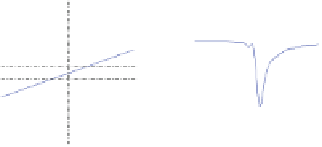
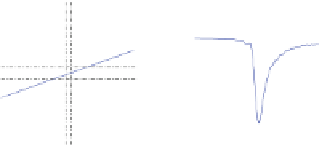
Fig. 4.5 OWF effect on the wind field due to different OWF districts and number of wind
turbines. (a) Arrangement of wind turbines around the center of the model area; consider a
zooming into the model area, and distances are given in
m. Red little diamonds
mark the position
of wind turbines for (a1) 12 turbines, (a2) 48 turbines, (a3) 80 turbines, and (a4) 160 turbines.
(b) 10-m horizontal real wind speed field of run OWFr after 4 h of METRAS simulation.
Horizontal black dashed-dotted lines
encase the OWF district around the model center.
Black
solid lines
from SW to NE and NW to SE mark cross sections in and orthogonal to wind direction.
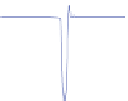
(c) Shows the 10-m wind speed of OWFr along cross section SW-NE (a3-d3) and along NW-SE
(a4-d4)
T012 and T048, but the effect is not as strong as in the case of T080. On one hand,
such discrepancies between T080 and T160 lie in a weaker change in the pressure
field around OWF for T080. On the other hand, the mean wind speed and the wake
magnitude are obviously concentrated on the OWF district, and in the case of an
OWF over more grid cells, which means in the case of a greater OWF, a better
model accuracy is provided.


Search WWH ::

Custom Search