Civil Engineering Reference
In-Depth Information
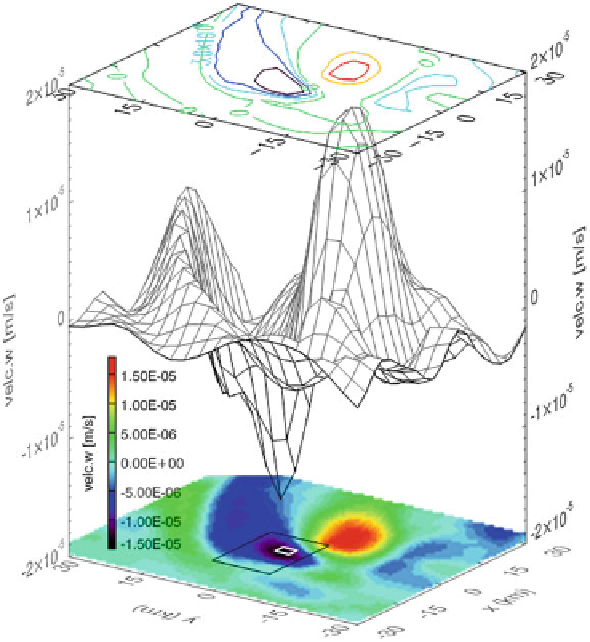
Fig. 9.9 Simulated vertical velocity component
w
with the ocean model HAMSOM at 2-m depth.
White square
shows the position of the OWF;
black square
illustrates the
big square
around the
wind farm after modification of horizontal dimension in Sect.
5.4
9.2 Comment on Result Presentation
The analysis of model results and measurements focuses, on one hand, on the whole
model area and, on the other hand, along sections through the model area and on
special points. With the following graphics, positions of OWFs and investigation
locations, which are used in the analysis, are clarified. Graphic Fig.
9.10
shows how
small the different OWF districts are. Graphic Fig.
9.11
underlines cross sections
through OWF, which were mostly used to illustrate the OWF
s effect on the ocean
in the vertical. Lastly, graphic Fig.
9.12
documents positions of location within the
model area. Position
P
0, respectively
P
3, is placed within OWF at southeasterly
grid box of the 12-turbine OWF district. Distance to S-N cross section of positive
positions (
P
+
'
), it is 12 km.
P
2is6km
North to OWF center along S-N section;
P
3, 12 km South to it (Fig.
9.12
a and b).
) is 6 km; for negative positions (
P
...
...
Search WWH ::

Custom Search