Civil Engineering Reference
In-Depth Information
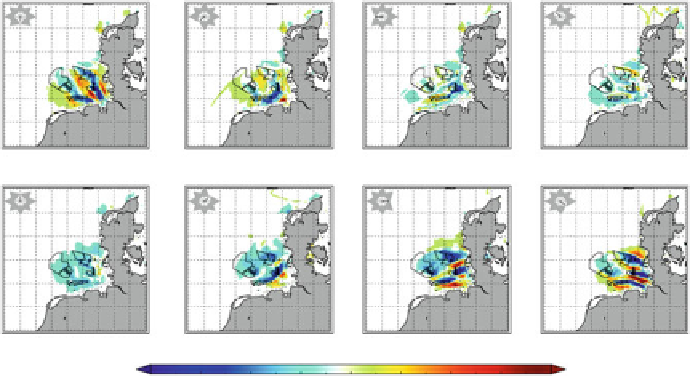
a
b
c
d
e
f
g
h
Fig. 6.14 Change in salinity concentration at surface due to OWFs in case of different wind
direction cases (gwind direction (a)-(h) from N to NW) after 1 day of simulation. The wind
direction is defined at height of geostrophic wind. Units are given in psu.
Dark gray shaded area
marks land;
light gray shaded area
marks bathymetry. Results are only for wind and pressure
forcing
a
b
c
d
e
f
g
h
Fig. 6.15 Change in salinity concentration at 12-m depth due to OWFs in case of different wind
direction cases (gwind direction (a)-(h) from N to NW) after 1 day of simulation. The wind
direction is defined at height of geostrophic wind. Units are given in psu.
Dark gray shaded area
marks land,
light gray shaded area
marks bathymetry, and
black solid lines
illustrate OWF
districts. Results are only for wind and pressure forcing


Search WWH ::

Custom Search