Civil Engineering Reference
In-Depth Information
a
b
c
d
3
456
7
891
0
3
45678
9
1
0
3
4
5
67891
0
3
456
7
891
0
gwind direction: N
gwind direction: NE
gwind direction: E
gwind direction: SE
3
4
56
7
891
0
3
4
56
78
91
0
3
4
56
7
891
0
3
4
56
78
91
0
m
in:−
1
4.16
hu
midity
m
ax: 11.2
1
m
in:
−
14.71
h
umidity
m
ax: 4.4
3
m
in:
−1
1.84
hu
midity
m
ax: 9.8
5
m
in:
−
12.64
h
umidity
m
ax: 3.0
7
−15.00
−10.00
−5.00
0.00
5.00
10.00
15.00
−15.00
−10.00
−5.00
0.00
5.00
10.00
15.00
−15.00
−10.00
−5.00
0.00
5.00
10.00
15.00
−15.00
−10.00
−5.00
0.00
5.00
10.00
15.00
e
f
g
h
anomaly [%]
anomaly [%]
anomaly [%]
anomaly [%]
3
456
7
891
0
3
45678
9
1
0
3
4
5
67891
0
3
456
7
891
0
gwind direction: S
gwind direction: SW
gwind direction: W
gwind direction: NW
3
4
56
7
891
0
3
4
56
78
91
0
3
4
56
7
891
0
3
4
56
78
91
0
min:−10.72
humidity
max: 5.18
min:−14.96
humidity
max: 4.41
min:−15.57
humidity
max: 3.33
min:−14.65
humidity
max: 3.47
−15.00
−10.00
−5.00
0.00
5.00
10.00
15.00
−15.00
−10.00
−5.00
0.00
5.00
10.00
15.00
−15.00
−10.00
−5.00
0.00
5.00
10.00
15.00
−15.00
−10.00
−5.00
0.00
5.00
10.00
15.00
anomaly [%]
anomaly [%]
anomaly [%]
anomaly [%]
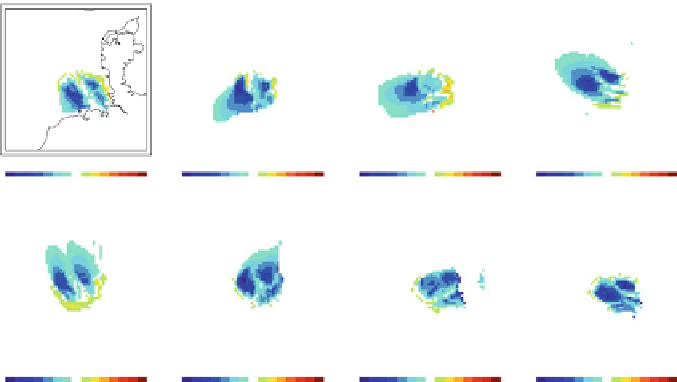
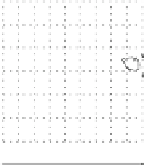
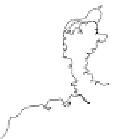
Fig. 6.5 Changes of 10-m relative humidity field due to operating OWFs after 1 day of METRAS
simulations for different wind direction cases. The change (OWFr-REFr) is given in percent. The
prescribed constant wind directions at height of geostrophic wind are N (a), NE (b), E (c), SE (d),
S(e), SW (f), W (g), and NW (h). Areas surrounded by
black solid lines
within the German Bight
are OWF areas comprising 8,590 wind turbines
A cooling is located windward of OWFs, that is, in wind direction in front of the
OWFs and mostly connected with land. With the exception of case East wind, the
temperature increase is slightly more dominant than the reduction.
The changes of the humidity in 10 m
are shown in Fig.
6.5
. The formation of the
changes is similar to the changes of temperature. In case of warming, humidity is
reduced by 11-15 %. In the case of cooling, humidity increases by 3-4 %, 11 % in
the case of north wind and around 9 % in the case of east wind.
Precipitation and cloudiness
were not formed within these simulation runs for
all wind cases.
Over ocean, the OWFs normally lead to a cooling by around one degree (Linde
et al.
n.d.
), while onshore farms lead to opposite effect (Baidya Roy
2004
; Baidya
Roy and Traiteur
2010
; Zhou et al.
2012
). Here, listed changes become quite
constant after 8 h of simulation. Therefore, the warming cannot be caused by the
diurnal cycle. The cooling and the increase of humidity are connected with warmer
dryer air coming from land, which flows over ocean and advects moisture. The SST
in METRAS is constant during the whole simulation time and is set to 15
C. The
10-m temperature fields do not reach temperatures below that value. The warming
in the area of wind reduction downstream of the OWFs is connected with vertical
In reality, a more unstable stratification is expected during the night over water,
supporting vertical mixing and a cooling in 10 m. During the day, the more stable


Search WWH ::

Custom Search