Civil Engineering Reference
In-Depth Information
a
b
c
d
3
4
5
6
7
8
9
1
0
3
4
5
6
7
8
9
1
0
3
4
5
6
7
8
9
1
0
3
4
5
6
7
8
9
1
0
gwind direction: N
gwind direction: NE
gwind direction: E
gwind direction: SE
3
45
6
78
91
0
3
45
6
78
91
0
3
45
6
78
91
0
3
45
6
78
91
0
min:−59.08
uv10
max: 24.
42
min:−58.91
uv10
max: 17.
08
min:−54.40
uv10
max: 21.
35
min:−59.33
uv10
max: 17.
16
−60.00
−40.00
−20.00
0.00
20.00
40.00
60.00
−60.00
−40.00
−20.00
0.00
20.00
40.00
60.00
−60.00
−40.00
−20.00
0.00
20.00
40.00
60.00
−60.00
−40.00
−20.00
0.00
20.00
40.00
60.00
anomaly [%]
anomaly [%]
anomaly [%]
anomaly [%]
e
f
g
h
3
4
5
6
7
8
9
1
0
3
4
5
6
7
8
9
1
0
3
4
5
6
7
8
9
1
0
3
4
5
6
7
8
9
1
0
gwind direction: S
gwind direction: SW
gwind direction: W
gwind direction: NW
3
45
6
78
91
0
3
45
6
78
91
0
3
45
6
78
91
0
3
45
6
78
91
0
min:−56.10
uv10
max: 26.19
min:−57.23
uv10
max: 20.69
min:−56.56
uv10
max: 20.84
min:−58.21
uv10
max: 25.24
−60.00
−40.00
−20.00
0.00
20.00
40.00
60.00
−60.00
−40.00
−20.00
0.00
20.00
40.00
60.00
−60.00
−40.00
−20.00
0.00
20.00
40.00
60.00
−60.00
−40.00
−20.00
0.00
20.00
40.00
60.00
anomaly [%]
anomaly [%]
anomaly [%]
anomaly [%]
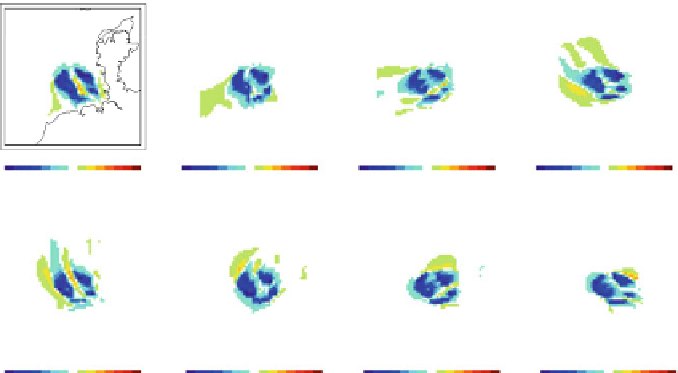
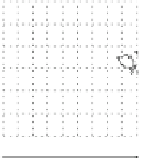
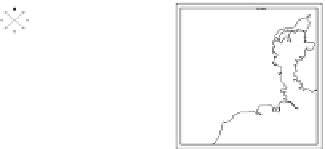
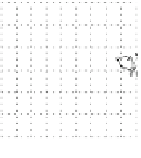
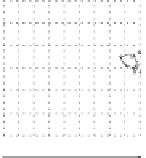
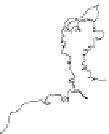
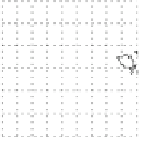
Fig. 6.3 Changes of 10-m horizontal wind field due to operating OWFs after 1 day of METRAS
simulations for different wind direction cases. The change (OWFr-REFr) is given in percent. The
prescribed constant wind directions at height of geostrophic wind are N (a), NE (b), E (c), SE (d),
S(e), SW (f), W (g), and NW (h). Areas surrounded by
black solid lines
within the German Bight
are OWF areas comprising 8,590 wind turbines.
Arrows
define real wind direction (OWFr) in 10-m
heights. Maximal changes of 60 % are located at OWF districts. In sum, changes are regionally
located within Germany
'
s EEZ
a
b
c
d
3
4567891
0
3
4
5
67891
0
3
4567891
0
3
4567891
0
gwind direction: N
gwind direction: NE
gwind direction: E
gwind direction: SE
3
45
67891
0
3
456
78910
3
45
67891
0
3
45
678910
m
in: −3.19
temperature
max: 4.80
m
in: −1.73
temperature
max: 5.36
m
in: −4.49
temperature
max: 4.06
m
in: −2.30
temperature
max: 4.63
−4.00
−2.00
0.00
2.00
4.00
−4.00
−2.00
0.00
2.00
4.00
−4.00
−2.00
0.00
2.00
4.00
−4.00
−2.00
0.00
2.00
4.00
anomaly [%]
anomaly [%]
anomaly [%]
anomaly [%]
e
f
g
h
3
4567891
0
3
4
5
67891
0
3
4567891
0
3
4567891
0
gwind direction: S
gwind direction: SW
gwind direction: W
gwind direction: NW
3
45
67891
0
3
456
78910
3
45
67891
0
3
45
678910
m
in: −3.58
temperature
max: 3.61
m
in: −1.35
temperature
max: 5.
41
m
in: −1.06
temperature
max: 5.10
m
in: −1.27
temperature
max: 5.
16
−4.00
−2.00
0.00
2.00
4.00
−4.00
−2.00
0.00
2.00
4.00
−4.00
−2.00
0.00
2.00
4.00
−4.00
−2.00
0.00
2.00
4.00
anomaly [%]
anomaly [%]
anomaly [%]
anomaly [%]
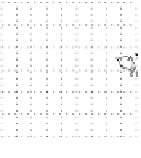
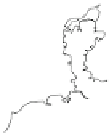
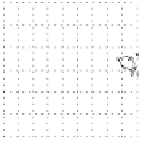
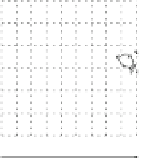
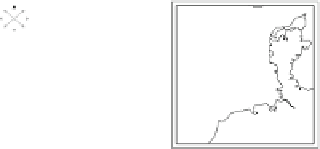
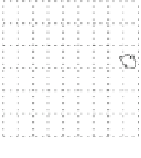
Fig. 6.4 Changes of 10-m temperature field due to operating OWFs after 1 day of METRAS
simulations for different wind direction cases. The change (OWFr-REFr) is given in percent. The
prescribed constant wind directions at height of geostrophic wind are N (a), NE (b), E (c), SE (d),
S(e), SW (f), W (g), and NW (h). Areas surrounded by
black solid lines
within the German Bight
are OWF areas comprising 8,590 wind turbines


Search WWH ::

Custom Search