Civil Engineering Reference
In-Depth Information
a
b
c
d
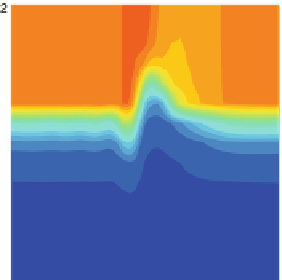
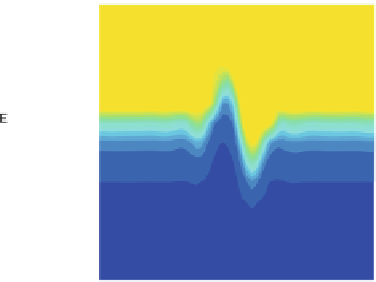
Fig. 5.45 HAMSOM
'
s result for temperature distribution against depth along (a) west, (b) north,
(c) south, and (d) east sections around the 12-turbine wind farm. Distance
Δ
x
and
Δ
y
of each
section to wind farm is 6 km (
big figures
).
Small figure
in the north section (b) shows result for
Δ
y ¼
18 km. Result is after 3 days of simulation T012ug08TS02HD30F01. Projection of wind
farm position is marked with
white dotted lines
with 30 km, measurements only with 3 km. The local field of extrema at surface has
a horizontal dimension of 7-10 km in the model, around 2 km in case of CTD
measurements.
The warmer region, at the
south section
(Fig.
5.45c
), spans a horizontal length of
around 14 km, the model 15-45 km. The maximum within the wind farm corridor at
the
east section
has similar dimensions in the horizontal for both data sets. But the
southern peak has a horizontal resolution of 4-5 km for CTD data, 20 km for the
model results.


Search WWH ::

Custom Search