Civil Engineering Reference
In-Depth Information
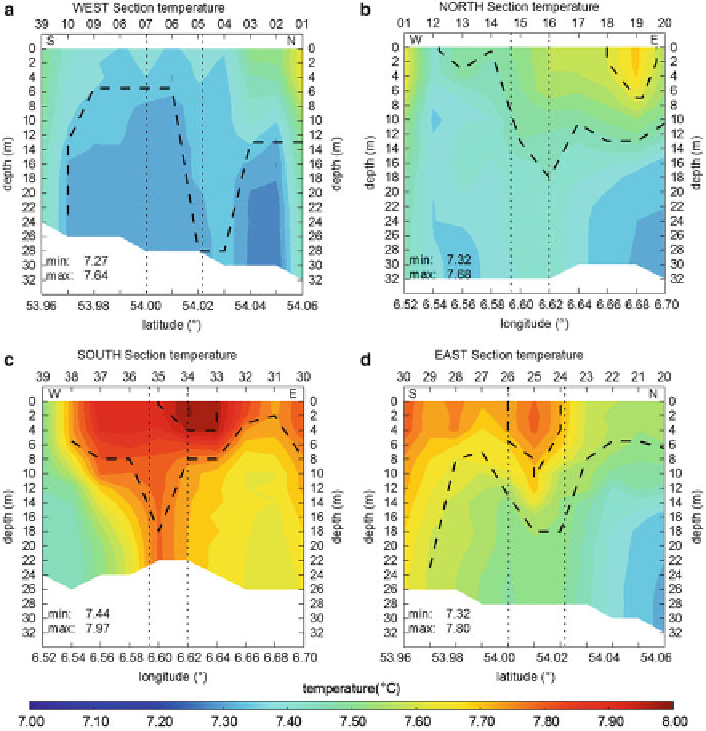
Fig. 5.44 CTD temperature sections (a-d) around the wind farm alpha ventus from May 12.
Illustration (a) gives west section, (b) north section, (c) south section, and (d) east section.
Black
dotted vertical lines
mark abreast with the wind farm.
Black dashed lines
accent temperature
formation comparable with HAMSOM model results. Temperature structure shows evidence of
vertical mixing due to the wind farm
'
s wind wake. Superior
x
-axis gives the number of CTD
position. Distance of sections to the wind farm counts 5.5-6.5 km. Length of latitude sections is
12.8 km and of longitude section, 10.9 km. In the horizontal, CTD was allocated without any
interpolation. In the vertical, data were averaged over 2 m, which is consistent with used vertical
resolution of HAMSOM
could be seen in the latitude of
alpha ventus
. A maximum was observed at the
eastern part of this section, which is a part being defined to be in the wind wake of
the wind farm (Fig.
5.44
). Moving from north to south
along the eastern section,
temperatures increased with a maximum drop in the zone behind the wind farm
alpha ventus
of 7.76
C.
Along the southern section
, the highest temperature values
occurred with a maximum of 7.97
C close to surface in the more eastern range of
the wind farm. Temperature values of 7.8
C reached the bottom forming a funnel at
Search WWH ::

Custom Search