Civil Engineering Reference
In-Depth Information
a
b
c
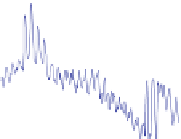
Fig. 5.43 Temperature (a), salinity (b), and flow velocity (c) of May 2013 at Fino1, including
measuring period 11-13 May at various available depths.
Horizontal dashed-dotted line
gives
median of shown variable
conditions (no precipitation) and slightly varying swell during the measuring
period, are considered in the following analysis of temperature.
Supposing the offshore wind farm
alpha ventus
has no effect on ocean dynamics,
we would expect standard temperature stratification with higher temperature in the
upper layers, a more or less clear thermocline (no excursion), and cooler layers
below. Also, and it
s important, we would expect that such a stratification occurs
over the whole area and is quite constant. The investigation area is placed in
shallow water strongly affected by wind. Therefore, the sea around the wind farm
alpha ventus
is expected as well as mixed with mostly no or very weak thermocline,
although solar radiation would support a formation of thermocline.
The CTD measurements result in a maximum SST of 8.0 and 7.0
C at bottom on
May 12, 2013. Though the weak temperature difference of 1.0
C is from top to
bottom, the CTD measurements show complex structures, which are illustrated in
Fig.
5.44
.
Precise structures in the vertical occur along the four sections of CTD in the
west, north, south, and east of
alpha ventus
. Zones of cooler and warmer temper-
atures were observed along the tracks, which look like an undulating formation
clarified by black dashed lines in Fig.
5.44
, which is evidence of the excursion of the
thermocline. All sections have in common that cooler temperature ridges border on
a trough of warmer temperature values. Such a zone of slightly raised temperatures
is mostly placed along the sections at the sector of
alpha ventus
between longitude
and latitude positions 54
N 6.57
E, 54.03
N 6.57
E, 54.03
N 6.62
E, and 54
N
6.62
E (district of
alpha ventus
test wind farm area
x
in Fig.
5.41
).
These zones,
'
from bottom to surface or surface to bottom, were
measured in all sections with various intensities. The western and northern sections
comprise cooler temperatures than the eastern and southern ones, with differences
of tenths of degree.
Along the western section
from south to north, a cooler ridge was formed with
values of 7.28
C blurring at 9-m depths (Fig.
5.44
). Another cooler ridge occurred
at the most northern part of this section with 7.25
C. A slightly warmer temper-
ature column disconnects these ridges beginning at the northern projected corner of
alpha ventus. At the northern section
, warmer temperatures transported to depth
bubbles
'
'


Search WWH ::

Custom Search