Civil Engineering Reference
In-Depth Information
a
b
c
d
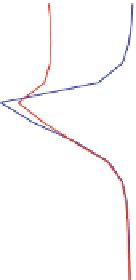
Fig. 5.35 Comparison of OWF effect on velocity components (a)
u
and (b)
w
,(c) temperature,
and (d) salinity based on forcing F01 (
blue
) and F03 (
red
) over depth at two, respectively for
u
-
component three, positions.
P
1(0,
12) (
solid lines
) is placed 12 km southerly of OWF and
P
2(0,6)
(
dashed lines
), 6 km northerly.
P
3(0,0) (
dashed-dotted lines
) for
u
-component is positioned within
the OWF.
Horizontal dotted line
marks depth of the thermocline; vertical one separates positive
and negative values
The cooling of the upper layers dominates the differences in hydrographics of
F01 and F03 at 12-m depth. Here, the temperature is correlated by 0.83, salinity
only by 0.25 due to discrepancies within the OWF and at
P
+ 1 in Fig.
5.36g
.
Accordingly, high are the RMSD of 0.45
C and 0.017 psu along the positions of
investigation. Below 12 m, the full forcing has only a weak impact on ocean
systems.
Figure
5.37
documents that ocean variables at 16 m over investigated positions
are highly correlated by 0.93-1.00. While
w
-component and temperature have the
best correlations, salinity gives the worst one. But from 18-m depth down to
bottom, the OWF effect of run F03 on salinity adjusts to the OWF effect of run F01.


Search WWH ::

Custom Search