Civil Engineering Reference
In-Depth Information
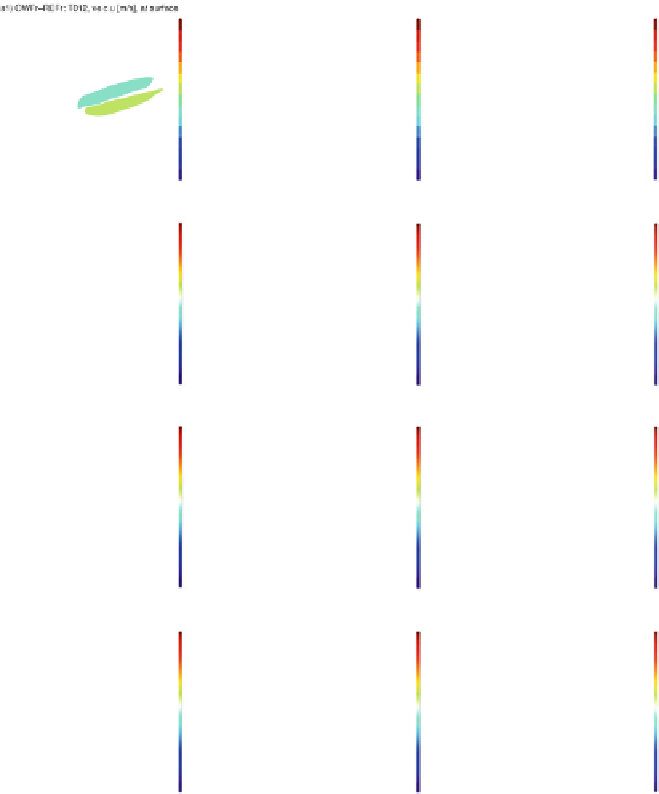
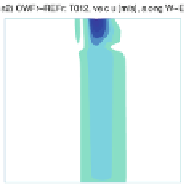
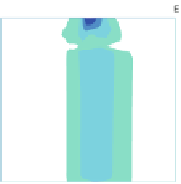
Fig. 5.27 Change of velocity component
u
(velc.
u
) due to different amounts of wind turbines.
Images (a1)-(a3) illustrate velocity component velc.
u
in the case of T012, (b1)-(b3) T048, (c1)-
(c3) T080, (d1)-(d3) T0160 at (a1)-(d1) surface, (a2)-(d2) along the W-E section and (a3)-(d3)
along the S-N section through the OWF.
Dashed-dotted lines
encase the OWF district.
Solid lines
denote the cross section through the OWF, and
dotted lines
in section plots mark the depth of the
thermocline based on T012. Units are given in m/s
bigger OWF, and so the wake flanks of increased velocities more strongly impact
deeper layers than T012.
The maximal wake magnitude is given by T048, as mentioned in Sect.
4.2
; the
reason for that context is that in T080 and T160, more grid cells, filled with fewer
wind turbines, are astonished by the wind turbines.


Search WWH ::

Custom Search