Biomedical Engineering Reference
In-Depth Information
120
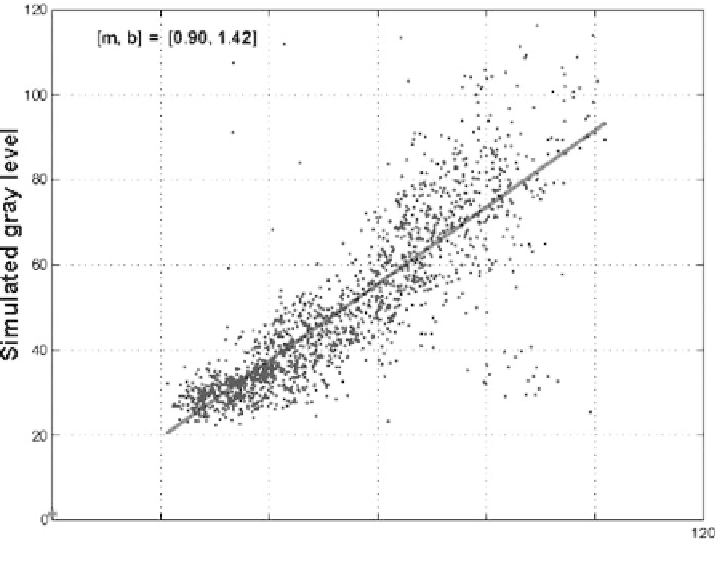
[m, b] = [0.90, 1.42]
100
80
60
40
20
0
20
40
60
real gray level
80
100
120
Figure 1.44:
Simulated versus real gray-level values for 20 ROIs comparing
pixel gray-level and the regression line.
a mean of
µ
=−
18
.
56 and deviation of
σ
=
24
.
01, and the media region has a
mean of
µ
=−
17
.
82 and a deviation of
σ
=
22
.
62. The gray-level differences
distribution displays a light asymmetry. As a result, the simulated image tends
to be brighter than the real image. The adventitia gray-level differences values
show a symmetric distribution with a center of
µ
=−
13
.
30 and a deviation of
σ
=
14
.
27.
Table 1.6: Mean and deviation of the
ROIs gray-level differences referred from
histograms in Figs. 1.46 and 1.47
ROI
µ
σ
Blood
2.44
15.13
−
Intima
18.56
24.01
−
Media
17.82
22.62
−
Adventitia
13.30
14.27
−