Biomedical Engineering Reference
In-Depth Information
100
50
80
40
60
30
40
20
20
10
0.025
0.035 0.04 0.045 0.05 0.055
0.0555
0.056
0.0565
0.057
0.0575
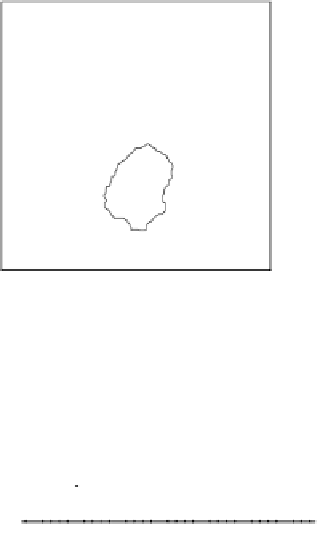
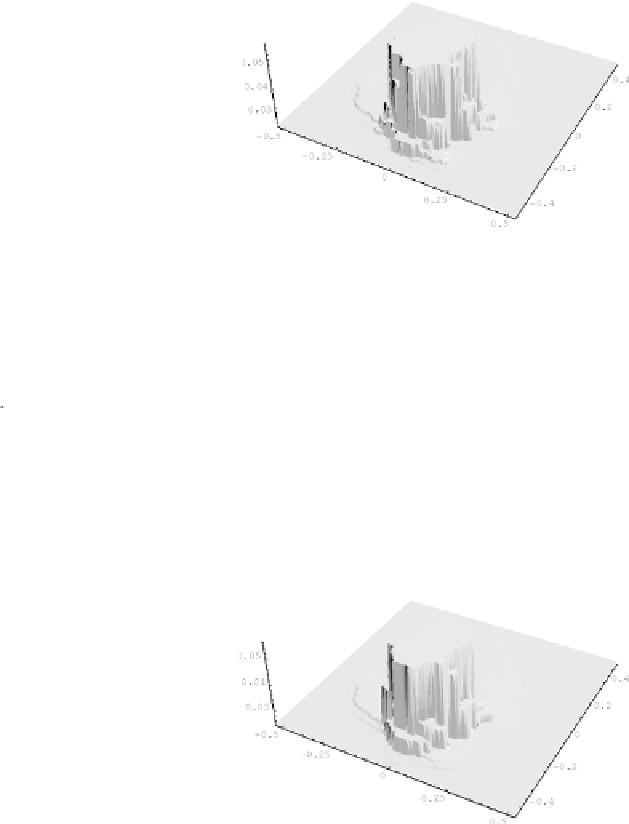
Figure 11.24:
Segmentation level line and graph of the segmentation function
for computation without convolution (top row) and histogram of the segmen-
tation function and its zoom (middle row). Segmentation level line and graph
of the segmentation function for computation with convolution (bottom row)
(color slide).