Biomedical Engineering Reference
In-Depth Information
100
100
80
80
60
60
40
40
20
20
0.0125 0.015 0.0175 0.02 0.0225 0.025 0.0275
0.015
0.02 0.025
0.03 0.035 0.04
100
100
80
80
60
60
40
40
20
20
0.015 0.02 0.025 0.03 0.035 0.04 0.045
0.0125 0.015 0.0175 0.02 0.0225 0.025
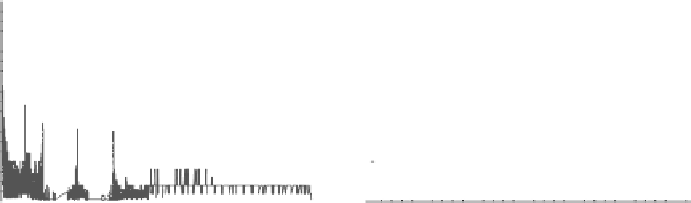
Figure 11.19:
Histogram of the segmentation result given by semi-implicit
scheme after 20 time steps (top left). Histograms of the segmentation func-
tion given by the explicit scheme after 500 (top right), 1000 (bottom left), and
5000 (bottom right) time steps (color slide).
prescribed SOR iterations lead to comparable segmentation with twice faster
CPU time as mentioned above.
Now, let us look at the behavior of the explicit scheme in this example. We
use the explicit version of the scheme (11.23) where also the second term on
the left-hand side is taken from the (
n
−
1)th time step. Then, due to stability
reasons, we have to choose
τ
=
5
×
10
−
6
. Although one explicit time step takes
just 0.05 sec (including construction of coefficients and explicit time update of
the solution), to get a segmentation result comparable with the semi-implicit
scheme we need about 10 000 time steps. In Fig. 11.19 we present histograms
of the segmentation function, where the plotted range [0
,
100] in the vertical
direction has been chosen for visualization. We compare histograms, because
one cannot use the same threshold
δ
for explicit and semi-implicit schemes due
to very small change in the solution between time steps in explicit scheme. In the
top left, there is a histogram of the segmentation result given by semi-implicit
scheme after 20 time steps. The shocks in solution (corresponding to outer and