Biomedical Engineering Reference
In-Depth Information
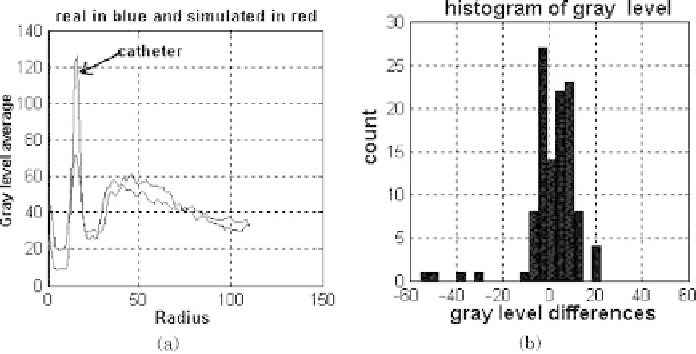
Figure 1.41: Global projection in the
R
direction (c), from Figs. 1.38(b) and (d),
the corresponding histogram gray-level differences are shown in (b).
The next step in the validation of the model is to show the significant corre-
spondence between real and simulated gray-level distribution data in the medi-
cal zones of interest. For this purpose, 20 validated real IVUS images and their
corresponding ROIs were selected. The spatial boundaries of the morphological
structures of the real data are kept in the synthetic data. Figure 1.42(a) shows
ten real IVUS images and their corresponding simulated (b) synthetic images.
The polar images are shown in Fig. 1.43.
Figure 1.44 shows the simulated versus real gray-level correlation for the
polar ROIs images selected as shown in Fig. 1.38. The linear correlation co-
efficients show a good gray-levels correspondence, these being
m
=
0
.
90 and
b
=
1
.
42. The best correspondence is located by low gray levels (20-40 gray lev-
els), lumen scatterers, lumen/intima transition, and adventitia. The transitions
of intima/media and media/adventitia (45-60 gray levels) indicate gradual dis-
persion. The CNRS average presents significative uniformity values,
µ
=
6
.
89
and
σ
=
2
.
88, for all validated frames. The CNRS as figure of merit for each
arterial validated region is shown in Fig. 1.45. The CNRS region mean, standard
deviation, and the SSE values referring to the 20 image frames are summarized
in Table 1.5. The lumen is a good simulated region, with mean
µ
=
0
.
46 and
deviation
σ
=
0
.
42. The explanation is that the lumen is not a transition zone,
the attenuation ultrasound intensity in this region is very poor (1-2%), which
determines a simple gray-level profile.