Biomedical Engineering Reference
In-Depth Information
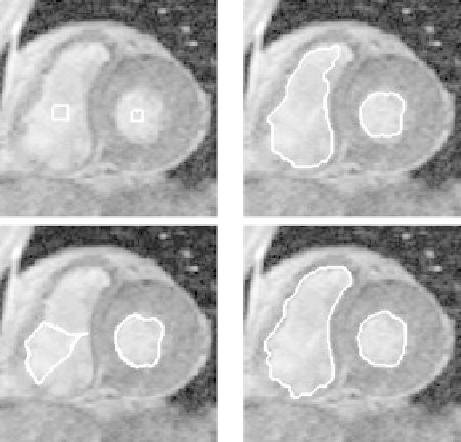
Figure 10.21: Heart MRI image. Top row: initial snakes and standard geometric
snakes. Bottom row: GGVF snakes and final RAGS snakes showing improvement
on the top right of the left snake and the lower region of the right snake.
dard snake leaks out of the object, similar to the effect demonstrated with the
synthetic image in Fig. 10.15.
10.9.5 Results on Color Images
We now consider the performance of the RAGS snake on color images. In
Fig. 10.23 we can see a cell image with both strong and fuzzy region bound-
aries. Note how the fuzzy boundaries to the right of the cell “dilute” gradually
into the background. So the results in the top-right image again demonstrate
an example of weak-edge leakage, similar to the example in Fig. 10.22, where
the standard geometric snake fails to converge on the outer boundary. The mid-
dle and bottom rows show the converged RAGS snake using the oversegmen-
tation and undersegmentation color region maps produced by the mean shift
algorithm.
A very similar example is demonstrated in Fig. 10.24 in application to images
of the optic disk in which the blood vessels have been removed using color math-
ematical morphology techniques. Again, the failing performance of the standard