Biomedical Engineering Reference
In-Depth Information
(a)
(b)
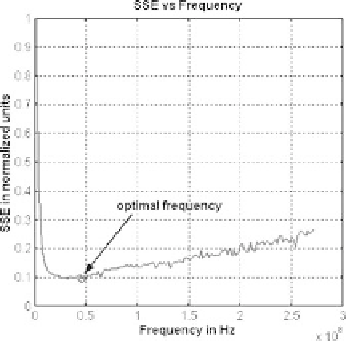
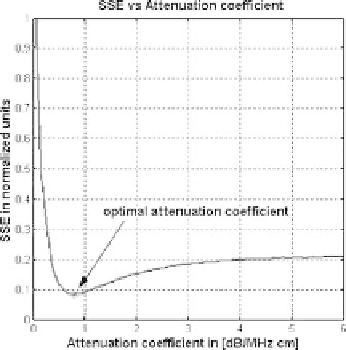
Figure 1.30: The optimal ultrasound simulation frequency
f
o
≈
46 MHz (a) and
the optimal attenuation coefficient (b)
α
≈
0
.
8dB
/
MHz cm are obtained by the
cross validation method.
is located in the interval 40-50 MHz. Note that the central frequency of Boston
Sci. equipment is 40 MHz; therefore, it can be considered as evidence to show
the correctness of the method.
1.6.3.3 Optimal Attenuation Coefficient
We have emulated synthetic IVUS images with different attenuation coefficients;
the optimal attenuation coefficient was tested by applying the cross validation
method of the synthetic images versus the real images. Figure 1.30(b) shows SSE
versus attenuation coefficient
α
; the optimal attenuation coefficient obtained
was 0.8 dB/MHz cm. There is a range of suboptimal attenuation coefficient values
for a fixed ultrasound frequency due to the great axial variability of scatterers.
However, the attenuation coefficient can be taken as constant for each simulated
region [28]; however, in the transition zones (lumen/intima, intima/media, and
media/adventitia) the attenuation gives great variability. For this reason, we
must average the attenuation coefficient value. It is very important to confirm
that the optimal frequency is approximating the standard central ultrasound
frequency of 40 MHz and that the attenuation coefficient is near the standard
values of biological tissues, which ranges from 0.5 to 1 dB/MHz cm. This result
can be used in different ways: first, to check the used simulation parameters in