Biomedical Engineering Reference
In-Depth Information
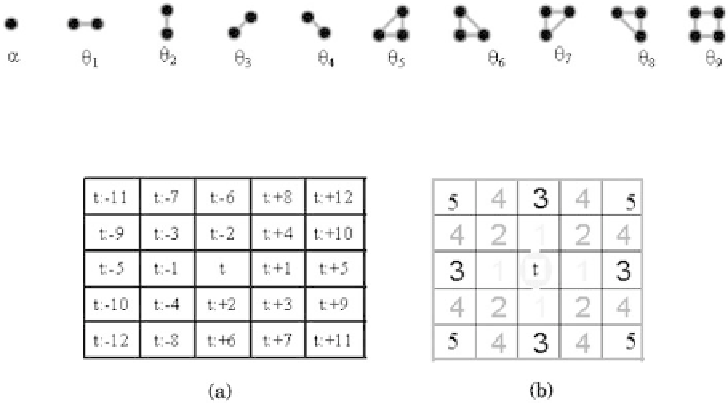
Figure 9.1:
Cliques for a first-order neighborhood, where
α
,
θ
1
, and
θ
2
are the
cliques coefficients for first-order neighborhood system.
Figure 9.2:
Cliques for a second-order neighborhood, where
α
,
θ
1
,
...,θ
9
are
the cliques coefficients for second-order neighborhood system.
Figure 9.3:
Numbering and order coding of the neighborhood structure.
where
F
is the potential function for single-pixel cliques and
H
is the poten-
tial function for all cliques of size 2. The parameter
w
depends on the size of
the neighborhood around each site. For example,
w
is 2, 4, 6, 10, and 12 for
neighborhoods of orders 1, 2, 3, 4, 5, respectively.
Using the Derin-Elliott model [15] to compute
F
and
H
, we have
F
(
x
t
)
=
α
x
t
and
H
(
x
t
,
x
t
:
+
r
)
=
θ
r
I
(
x
t
,
x
(
t
:
+
r
))
,
where
I
(
a
,
b
) is called indicator function where
I
(
a
,
b
)
=−
1 f
a
=
b
=
1 f
a
=
b
.
9.2.4 Image Models
As mentioned before, the observed image is modeled as a composite of two
random processes, a high-level process
X
and a low-level process
Y
[16-20].