Biomedical Engineering Reference
In-Depth Information
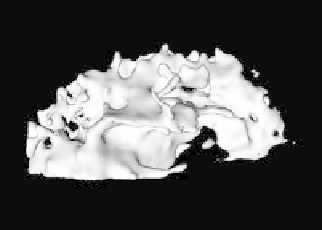
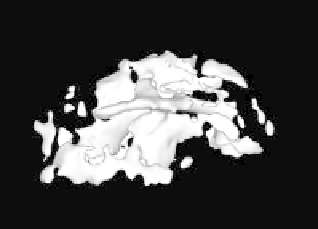
Figure 8.14: Model segmentation from volume
V
2
. Top left image is an isosur-
face of value 1.3, used for initialization of the level set. Clockwise are the results
of level set development with corresponding
β
values of 0.2, 0.4, and 0.5.
Hospital, City of Hope Hospital and Caltech to identify meaningful anatomical
structures. We applied our approach using a variety of parameter values, and
presented our results to them, asking them to pick the model that they felt
best represented the structures of the brain. Figure 8.14 contains three models
extracted from
V
2
at different values of smoothing parameter
β
used during seg-
mentation. Since we were not looking for a single connected structure in this
volume, we did not use a seeded flood-fill for initialization. Instead, we initialized
the deformation process with an isosurface of value 1.3. This was followed by
a level set deformation using a
β
value of 0.2. The result of this segmentation is
presented on the bottom-left side of Fig. 8.14. The top-right side of this figure
presents a model extracted from
V
2
using an initial isosurface of value 1.4 and a
β
value of 0.5. The result chosen as the “best” by our scientific/medical collabo-
rators is presented on the bottom-right side of Fig. 8.14. This model is produced
with an initial isosurface of 1.3 and a
β
value of 0.4. Our collaborators were able
to identify structures of high diffusivity in this model, for example the corpus
callosum, the internal capsul, the optical nerve tracks, and other white matter
regions.