Biomedical Engineering Reference
In-Depth Information
(a)
(b)
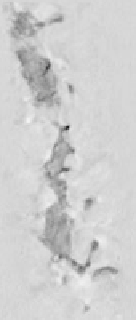
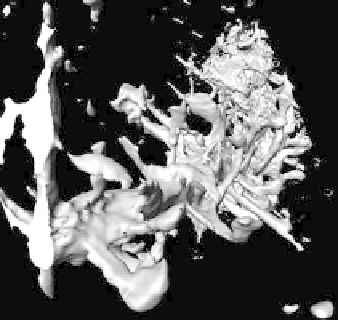
Figure 8.6: (a) One slice of a 154
×
586
×
270 TEM scan of a spiny den-
drite shows low contrast and high noise content in a relatively complex
dataset. (b) An isosurface rendering, with prefiltering, shows how noise and
inhomogeneities in density interfere with visualizing the 3D structure of the
dendrite.
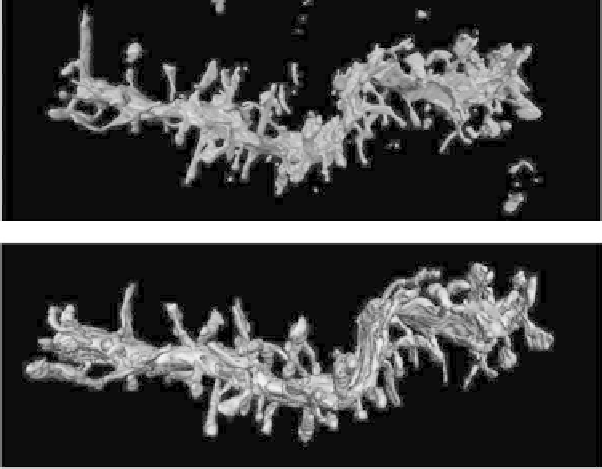
Figure 8.7:
(Top) rendering of a dendrite segmented using our pro-
posed method. (Bottom) rendering of a manual segmentation of the same
dendrite.