Biomedical Engineering Reference
In-Depth Information
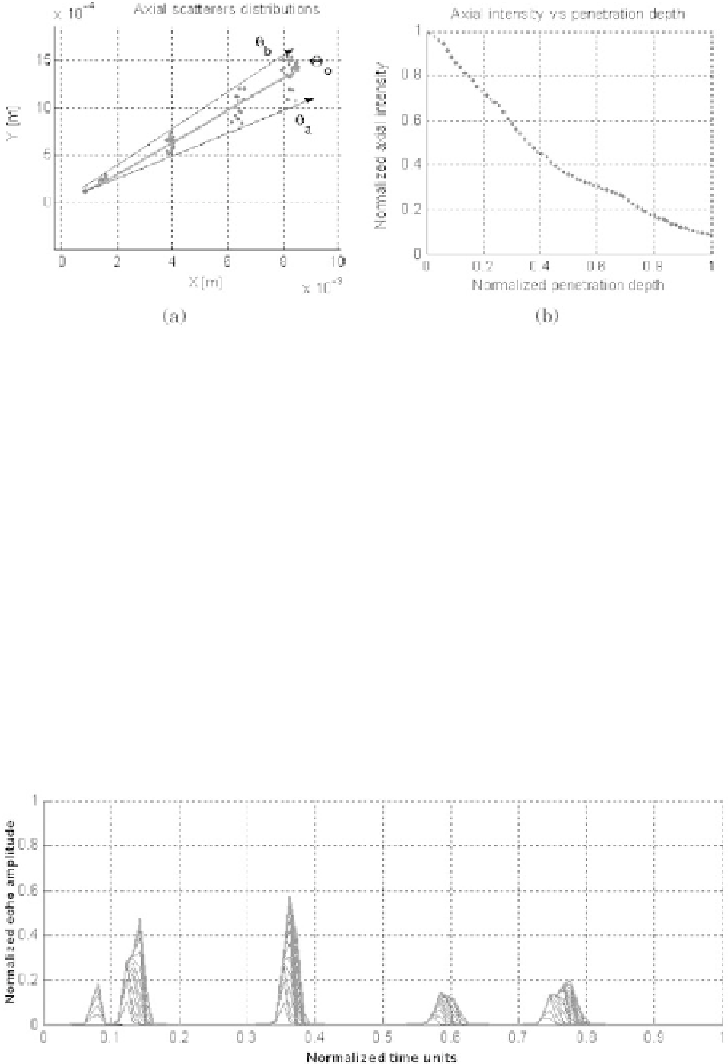
Figure 1.21: The 1D echogram is obtained by fixing the angular position
0
=
of the ultrasound beam (a). The total signal
S
(
t
) is only generated by the scatter-
ers
N
located at an angular position
a
≤
0
≤
b
. The intensity distribution
decreases with the depth penetration and the scatterers numbers
N
through
the beam path (b).
axially through scatterers (Fig. 1.21(a)) and its intensity distribution decreases
(Fig. 1.21(b)) with the penetration depth and the scatterers numbers in the
ultrasound path given by Eq. (1.8). The echo amplitude is registered by the
transducers (Fig. 1.22) as a signal function of time
S
(
t
) (Eq. 1.13). The value
is transformed to penetration depth replacing
t
=
x
/
c
and normalized to gray
scale. The spatial distribution of cross-section scatterers,
σ
, is generated by
Figure 1.22: The corresponding echoes are finally transformed to normal-
ized echo amplitude and then to gray-level scale versus time or penetration
depth.