Biomedical Engineering Reference
In-Depth Information
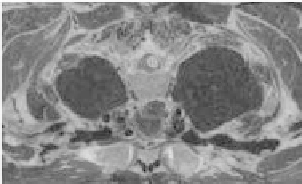
Figure 7.3:
Original grayscale image of human's torso.
defined over the image domain (fuzzy fields [33, 76], for example). The aim is to
find statistical representation of the objects, which means:
p
∈
O
=⇒ |
I
(
p
)
−
µ
| ≤
k
σ,
(7.22)
where
k
is an used defined parameter [49].
In some applications, a threshold
T
could be enough to characterize the
object(s).
Iterative
and
entropy
methods can be obtained by simple inspection
[40].
For an illustrative example, Fig. 7.3 shows an image of a cross section slice of
a human's torso, where we can see several interesting regions such as arteries,
bones, and lungs (the two largest central black regions).
Suppose we are interested in extracting the boundary of the right lung. First
of all, we should isolate, in each slice, the region of interest.
Applying Eq. (7.22) with a threshold, e.g. 30, we have as output the result
pictured in Fig. 7.4(a). Thus, an isoline extraction method can be used to get a
rough approximation of the target boundary. Figure 7.4( b) shows the obtained
curve over the original data.
We can observe that the curve is not smooth, there are protrusions and
concavities due to inhomogeneities of the image field. Besides, some regions
of interest may be merged (or even slit) after binarization. Such difficulties
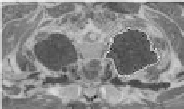
(a)
(b)
Figure 7.4:
(a) Result of applying a threshold
T
=
30 over image of Fig. 7.3.
(b) Initialization through isoline extraction.