Biomedical Engineering Reference
In-Depth Information
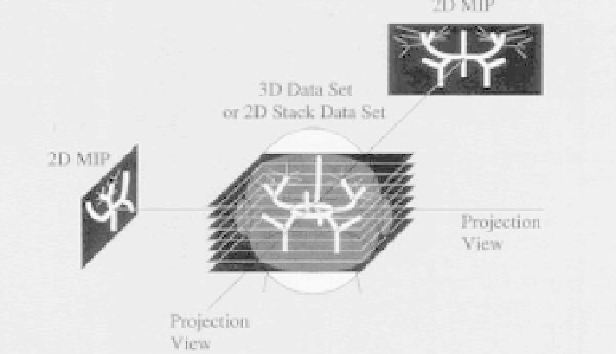
Figure 3.10: Maximum intensity projection: 3D structure is represented on a
2D plane based on the maximum signal intensity. Projecting successive views
from different angles results in an apparent rotation when later displayed in a
cine loop.
appearance of rotation and depth. These images result in a three-dimensional
representation of the vascular structures. Angiographic imaging parameters are
selected to maximize the signal intensity of vascular structures. For this, the
MIP procedure produces projection images in which vessels appear bright and
the background signal intensity is reduced. The MIP technique has limitations
despite improved contrast. It results in a slight decrease in vessel size. So, this
technique contributes to an overestimation of stenotic regions. The MIP pro-
cess also slightly reduces the diameter of normal vessels. The MIP projection
images lack increased signal at points of vessel overlap. A ray tracing through a
region of vessel-overlap selects the brightest pixel along the ray. It presents the
overlapped vessels as a single vessel.
3.2.2 3D TOF MRA
A pulse sequence is represented for 3D TOF MRA (see Fig. 3.6). A slab of several
cm (usually about 5 cm) is obtained which contains up to 28-60 slice 3D volumes
in axial plane through region of interest. The slice thickness is 0.7-1.0 mm, repe-
tition time is 40 msec, and flip angle is 15-20
◦
with FOV of 16-20 cm, depending
on the patient size and region of interest. Depending upon the desired resolution