Information Technology Reference
In-Depth Information
3 Case Studies
3.1
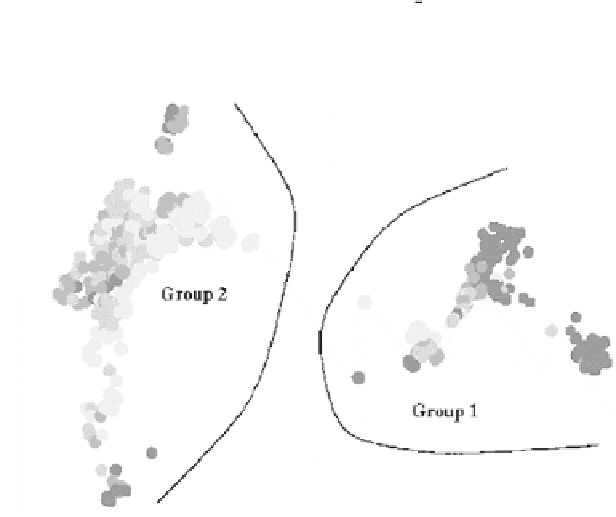
Case Study 1: Interactive Data Mining of Housing Data
The Boston Housing Data [3] is a classic, well-known dataset available from the
UCI Machine Learning repository [2]. Haiku was used to visualize the data. The
complex clustering shown in Fig. 3 was revealed.
Two fairly distinct groups of data are visible, which show smaller internal
features such as sub-groups. The two main groups were selected using the mouse,
and short, accurate, classification rules were requested from the data mining sys-
tem. These rules are shown:
Bounds river = true
⇒
GROUP 1
Accuracy: 100% Coverage:43%
PropLargeDevelop = 0.0 AND 9.9
≤
older properties percent
≤
100.0 AND Pupil teacher ratio = 20.2
⇒
GROUP 1
Accuracy: 94% Coverage: 83%
Bounds river = false AND 4
≤
Highway access
≤
8
⇒
GROUP 2
Accuracy: 100% Coverage: 77%
Bounds river = false AND 264
≤
Tax rate
≤
403
⇒
GROUP 2
Accuracy: 100% Coverage:69%
2.02
<
Industry proportion
≤
3.41
⇒
GROUP 2
Accuracy:98% Coverage: 13%
Fig. 3.
Clustering of Boston Housing Data.


Search WWH ::

Custom Search