Information Technology Reference
In-Depth Information
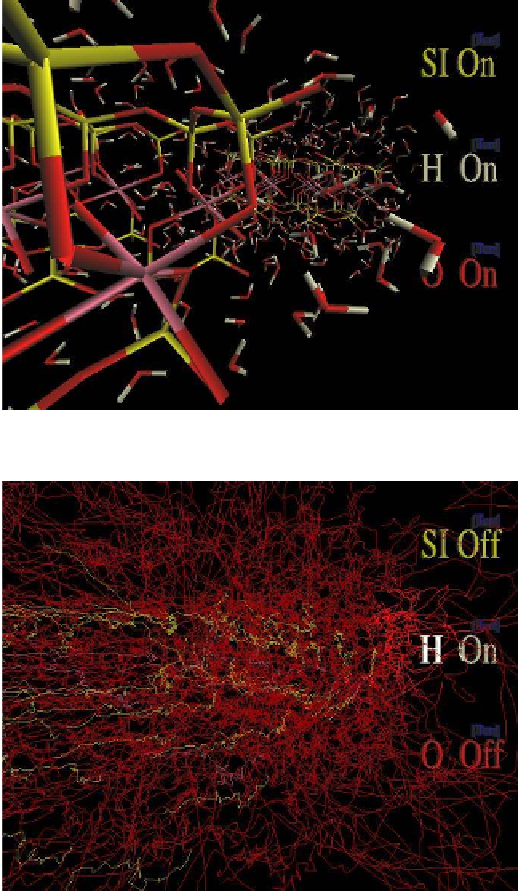
Fig. 14.
Animated stick-figure representation of the
smart gel
simulation.
Fig. 15.
Atom path representation of the
smart gel
simulation.
enhancements. The added menus were easily implemented using the techniques
previously described. Menu items allow the different visual representations of
the data to be turned on and off, the animation to be stopped and started, and
paths to be made visible based on identity.
The implementation of the immersive visualization for this project was well
served by our philosophy used in the IVE (loosely coupled programs that work
well together). A new data filter was created using a scripting language to convert
the time series data produced by the numerical simulation program into a form
Search WWH ::

Custom Search