Information Technology Reference
In-Depth Information
community has institutionally embraced the use of wireless devices in course
work, group meetings and other daily tasks, effectively providing a glimpse of
what future user communities may look like. The second group represents the
remainder of the campus community who use the wireless network to varying
degrees and primarily for convenience.
5.2
Home-Node
The amount of time that a user spends at each location is an important measure
of mobility. The home-node is defined as the network access point that the user
is connected to for the greatest amount of time. Users who spend extensive time
at a home-node tend to use their workstation or laptop in a single o
ce or
dormitory room. To determine the home-nodes, the time spent by unique each
MAC address at each access point over the 4 month period was calculated.
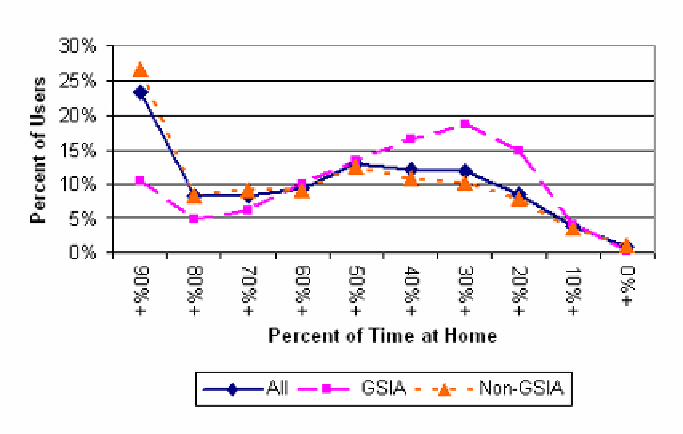
Figure 5 shows that most users spend a majority of their time at their home-
node. Specifically, 62% of all wireless users spend 50% or more of their time at
their home location and slightly over 8% of the wireless users never utilize more
than a single access point. A significant number (23.4%) of users spend over 90%
of their time on a single access point. As such, the performance of the home-node
largely determines the online experience for users that do not exhibit extensive
movement patterns.
The two distinct, GSIA and non-GSIA, communities on campus show signif-
icant differences in the percentage of time spent at their home-nodes. Non-GSIA
users are over twice as likely to have a home-node where they spend over 90%
of their time. The median time spent at the home-node for GSIA users is 46.7%
while the median time for non-GSIA users is 63.9%. Measured by the home-
node metric, GSIA users are considerably more mobile than their counterparts
in other departments.
Fig. 5.
PercentofTimeatHomebyusergroups.
Search WWH ::

Custom Search