Information Technology Reference
In-Depth Information
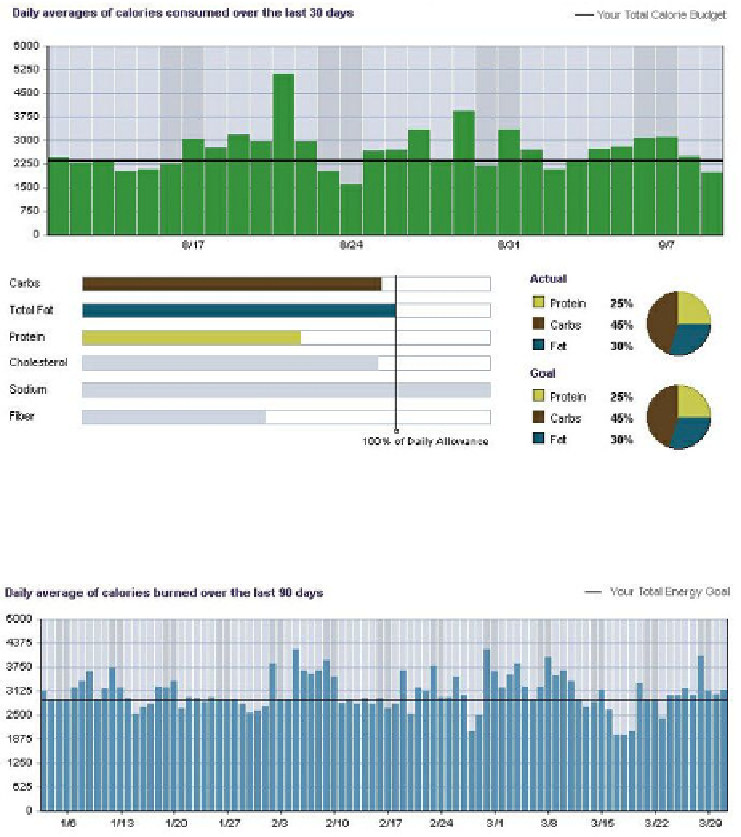
Fig. 8.
This figure shows the thirty day summary of calories consumed and nutri-
tion. The users' energy consumption daily goal is shown as 2260 calories. Below the
consumption graph is a break down of their actual food intake against their goal.
Fig. 9.
This figure shows a ninety day summary of energy expenditure. The horizontal
black bar is the user's goal energy expenditure, one vertical bar per day, the darker
vertical lines indicate weekends. users can look for lifestyle patterns over time.
translate the wearer's data into accurate caloric expenditure feedback. Together
with the wearer's nutritional intake which is entered in the Weight Center soft-
ware, the system records, trends, and presents the user's calories burned, calories
consumed, and the balance between the two; information that is critical when
trying to lose weight, but never previously available outside the laboratory.
A calorie deficit is required if one is to lose weight. However, tracking calories
consumed is dicult and accurately counting calories burned has been virtually
impossible outside of a clinical environment (see Fig. 6).
Search WWH ::

Custom Search