Information Technology Reference
In-Depth Information
Fig. 3.
A nano-structure of gold and copper atoms. Visualization is created with the
Glyph Toolbox.
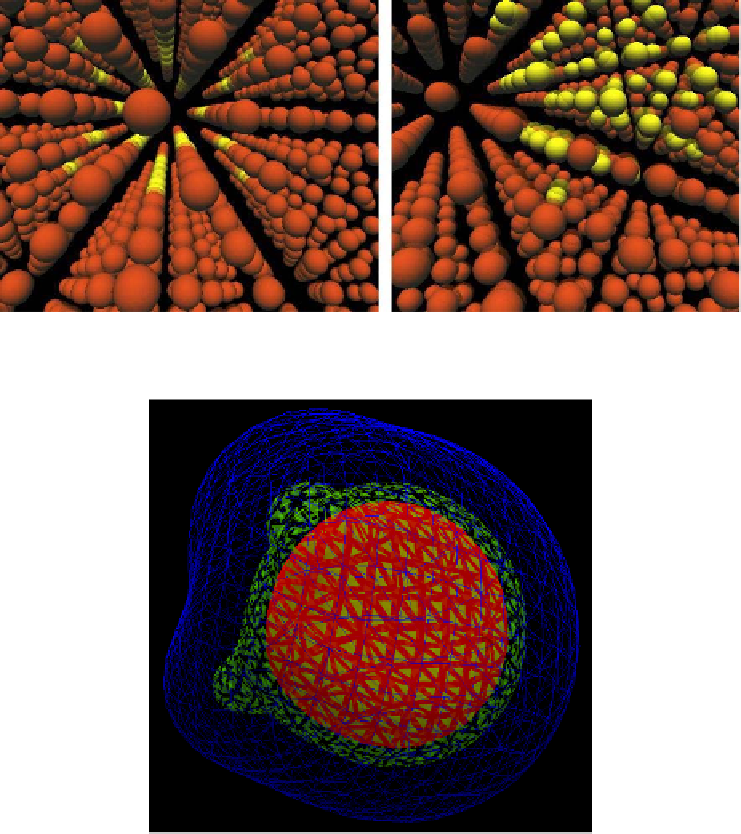
Fig. 4.
Use of transparency and shrinkage in the SAVG file format to display isosurfaces
of electron density of a water molecule.
In order to visualize data as quickly as possible, it is important to use what
has already been done. To this end we use other software to create a variety
of representations. For example visualization packages such as openDX [24] and
VTK [25] easily generate representations such as isosurfaces. Output from these
packages is converted to our own format and loaded into the IVE via DIVERSE.
See Fig. 6 for an example of a set of isosurfaces visualized this way.
We can get data into the IVE quickly, once we have created converters from
the format of outside software packages to a format that our environment rec-
ognizes. But the software packages providing the data need not be visualization
Search WWH ::

Custom Search