Environmental Engineering Reference
In-Depth Information
Table 4.1
Trends in the generation of municipal solid waste
Pounds per person
per day
Total MSW generation
(millions of tons)
Year
2008
2007
4.5
4.6
250.0
254.1
2006
4.6
251.3
2002
4.6
239.4
2000
4.6
238.3
1990
4.5
205.2
1980
3.7
151.6
1970
3.3
121.1
1960
2.7
88.1
Source:
Environmental Protection Agency, Quantity of Municipal Solid Waste
Generated and Managed, 2009.
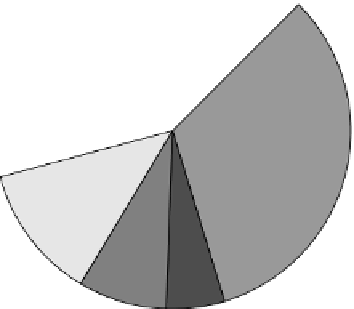
Food scraps
12.5%
Yard trimmings
12.8%
Other
3.2%
Wood
5.6%
Rubber, leather,
and textiles
7.6%
Paper and paperboard
32.7%
Plastics
12.1%
Metals
8.2%
Glass
5.3%
Figure 4.1
Percentages of materials in municipal solid waste in 2007. (Environmental Protection
Agency, 2008)