Environmental Engineering Reference
In-Depth Information
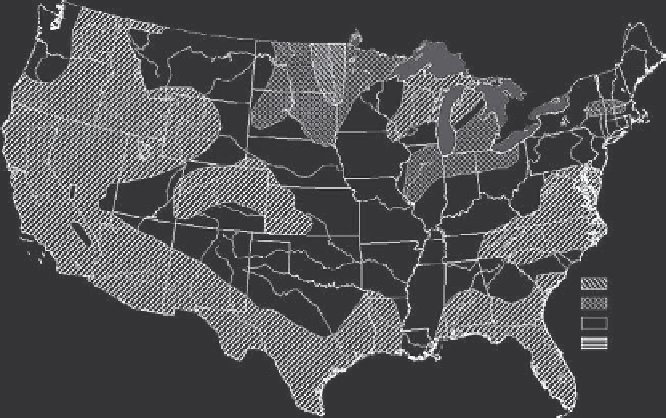
Flood Risk
(as of 3/18/09)
High
Above average
Average
Below average
Figure 3.1
Flood risk map of the United States showing the extreme risk of fl ooding on the Red River
in late March 2009. The Red River fl ows in the middle of the “high risk” area that follows
the border between North Dakota and Minnesota. (National Weather Service, March 18,
2009)
of land in the world, similar to the planar bottom surface of ancient Lake
Bonneville in Utah where race cars are tested. The average slope of the
river channel is about what you would get by slipping a single sheet of
paper under an eight-foot sheet of plywood. At Fargo, the site of the
2009 fl ood, the river bed drops only about 5 inches for each mile of
fl ow, fl atter than the slope of the top surface of a pancake on a breakfast
plate. At other areas along the river, the slope is only 1.5 inches per mile.
This means that when the river is in fl ood, the water spills in all direc-
tions over the surrounding area. Thousands of data points would be
needed to make predictions of fl ood levels, not only a few depth gauges
at scattered locations.
Heavy snows or rains on saturated or frozen soil have caused a
number of catastrophic fl oods along the Red River, which often are made
worse by the fact that snowmelt starts in the warmer south and waters
fl owing northward are often dammed or slowed by ice. These periodic
major fl oods have the effect of partially refi lling the ancient lake. During
the 2009 fl ood, the river rose quickly but did not crest as high as was
feared, and then the water level dropped faster than expected. The best