Database Reference
In-Depth Information
I II III IV
x y x y x y x y
10.0 8.04 10.0 9.14 10.0 7.46 8.0 6.58
8.0 6.95 8.0 8.14 8.0 6.77 8.0 5.76
13.0 7.58 13.0 8.74 13.0 12.74 8.0 7.71
9.0 8.81 9.0 8.77 9.0 7.11 8.0 8.84
11.0 8.33 11.0 9.26 11.0 7.81 8.0 8.47
14.0 9.96 14.0 8.10 14.0 8.84 8.0 7.04
6.0 7.24 6.0 6.13 6.0 6.08 8.0 5.25
4.0 4.26 4.0 3.10 4.0 5.39 19.0 12.50
12.0 10.84 12.0 9.13 12.0 8.15 8.0 5.56
7.0 4.82 7.0 7.26 7.0 6.42 8.0 7.91
5.0 5.68 5.0 4.74 5.0 5.73 8.0 6.89
(a)
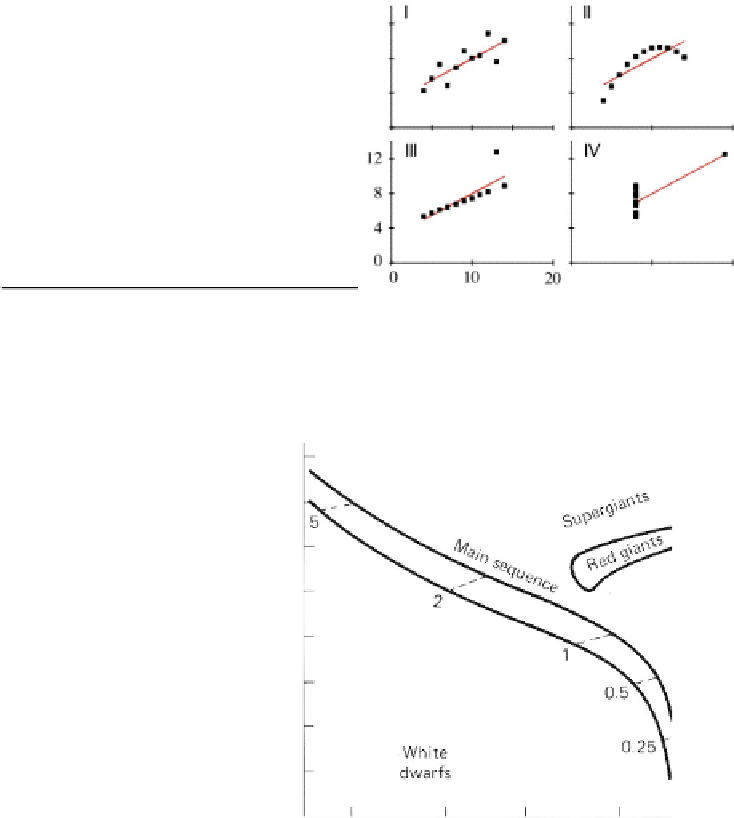
Four datasets with different values and
the same statistical profile
(b)
Dot Plot of the four datasets
Fig. 6.
Anscombe's Quartet
(a)
Hertzsprung Russell Diagram
(b)
Standard
interpretation
of
the
Hertzsprung Russell Diagram
Fig. 7.
Hertzsprung Russell Diagram and its standard interpretation
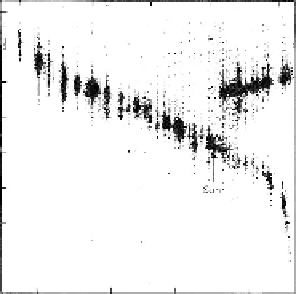
turns out that no automatic analysis method has been able to find the same
summarization, due to the noise and artifacts on the data such as the vertical
bands.
Our vision system has evolved with the human specie to help us survive
in a hostile world. We train it to avoid obstacles since we learn how to walk.
It remains remarkably effective at filtering-out noise from useful data, a very
important capability for hunters in deep forests to distinguish the prey moving


Search WWH ::

Custom Search