Database Reference
In-Depth Information
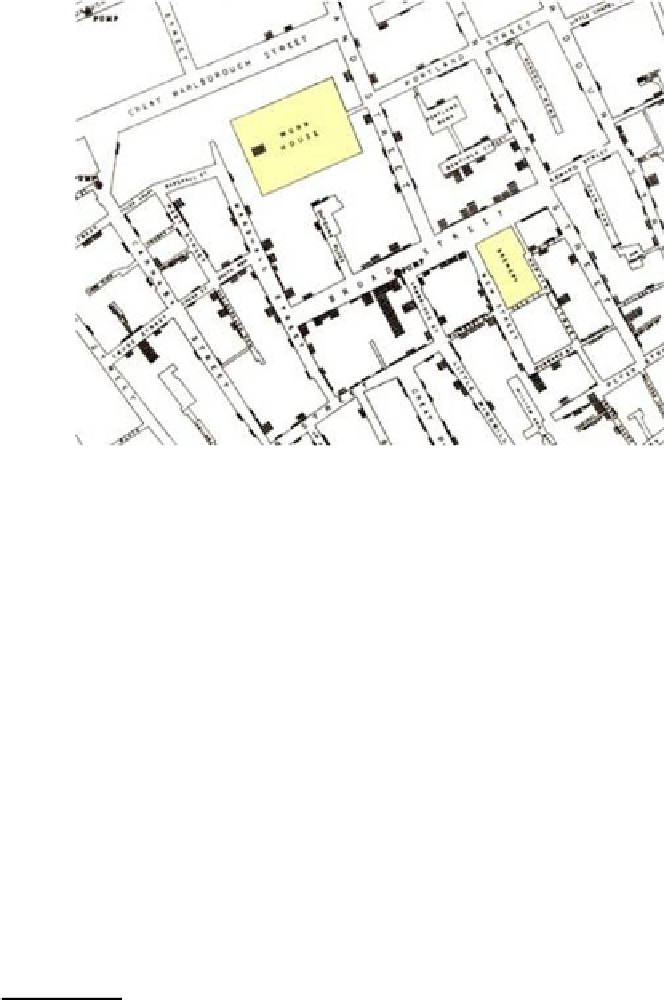
Fig. 4.
Illustration of John Snow's deduction that a cholera epidemic was caused by a
bad water pump, circa 1854 [4]. Black rectangles indicate location of deaths.
unpopular neighborhoods around Washington D.C. since they are places where
the homes are cheaper, and the wealthy ones where the houses are more expen-
sive.
Many more examples can be found to demonstrate that InfoVis is effective.
The Map of the Market
6
, represented by a squarified treemap, is interesting
for people holding stocks or interested by economic matters. InfoZoom video
on the analysis of Formula 1 results
7
is interesting for car racing amateurs.
The video
8
comparing two large biological classification trees is interesting to
some biologists. The Baby Name Wizard's NameVoyager
9
is useful for persons
searching a name for their baby to come and a large number of other persons as
witnessed by [31].
With the advent of Social InfoVis through web sites such as Swivel
10
or IBM's
Many-Eyes
11
, more examples can be found to convince specific audiences. Still,
the process of explaining how InfoVis works remains the same: ask a question
that interests people, show the right representation, let the audience understand
the representation, answer the question and realize how many more unexpected
findings and questions arise.
6
http://www.smartmoney.com/marketmap/
7
http://www.infozoom.com/enu/infozoom/video.htm
8
http://www.fit.fraunhofer.de/~cici/InfoVis2003/StandardForm/Flash/
InfoZoomTrees.html
9
http://babynamewizard.com/namevoyager/
10
http://www.swivel.com
11
http://www.many-eyes.com
Search WWH ::

Custom Search