Database Reference
In-Depth Information
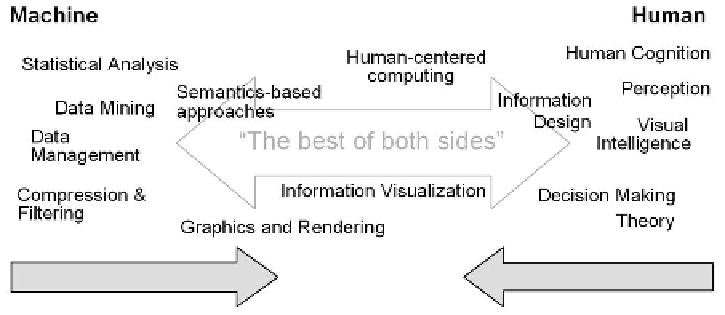
Fig. 2.
Visual analytics integrates scientific disciplines to improve the division of labor
between human and machine.
2 Definition of Visual Analytics
In “Illuminating the Path” [39], Thomas and Cook define visual analytics as the
science of analytical reasoning facilitated by interactive visual interfaces. In this
paper, however, we would like to give a more specific definition:
Visual analytics combines automated analysis techniques with interactive
visualizations for an effective understanding, reasoning and decision making on
the basis of very large and complex data sets.
The goal of visual analytics is the creation of tools and techniques to enable
people to:
-
Synthesize information and derive insight from massive, dynamic, ambigu-
ous, and often conflicting data.
-
Detect the expected and discover the unexpected.
-
Provide timely, defensible, and understandable assessments.
-
Communicate assessment effectively for action.
By integrating selected science and technology from the above discussed disci-
plines and as illustrated in Figure 2, there is the promising opportunity to form
the unique and productive field of visual analytics. Work in each of the partici-
pating areas focuses on different theoretical and practical aspects of users solving
real-world problems using Information Technology in an effective and ecient
way. These areas have in common similar scientific challenges and significant sci-
entific added-value from establishing close collaboration can be identified. Benefit
of collaboration between the fields is identified to be two-fold:
-
Jointly tackling common problems will arrive at better results on the local
level of each discipline, in a more ecient way.
-
Integrating appropriate results from each of the disciplines will lay the fun-
dament for significantly improved solutions in many important data analysis
applications.
Search WWH ::

Custom Search