Database Reference
In-Depth Information
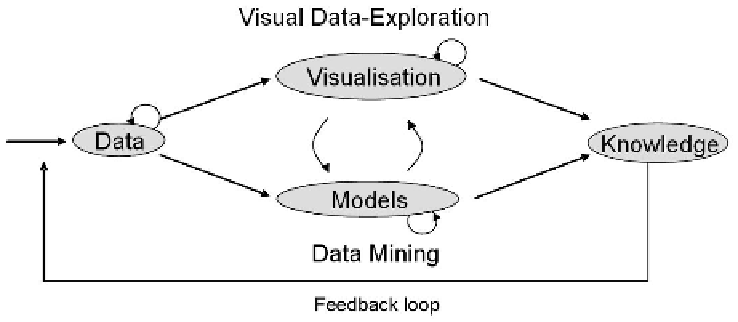
Fig. 1.
Tight integration of visual and automatic data analysis methods with database
technology for a scalable interactive decision support.
The user has to be the ultimate authority in giving the direction of the analysis
along his or her specific task. At the same time, the system has to provide
effective means of interaction to concentrate on this specific task. On top of
that, in many applications different people work along the path from data to
decision. A visual representation will sketch this path and provide a reference
for their collaboration across different tasks and abstraction levels.
The diversity of these tasks can not be tackled with a single theory. Visual
analytics research is highly interdisciplinary and combines various related re-
search areas such as visualization, data mining, data management, data fusion,
statistics and cognition science (among others). Visualization has to continuously
challenge the perception by many of the applying sciences that visualization is
not a scientific discipline in its own right. Even if the awareness exists, that
scientific analysis and results must be visualized in one way or the other, this
often results in ad hoc solutions by application scientists, which rarely match
the state of the art in interactive visualization science, much less the full com-
plexity of the problems. In fact, all related research areas in the context of visual
analytics research conduct rigorous, serious science each in a vibrant research
community. To increase the awareness of their work and their implications for
visual analytics research clearly emerges as one main goal of the international
visual analytics community (see Figure 2).
Because visual analytics research can be regarded as an integrating discipline,
application specific research areas should contribute with their existing proce-
dures and models. Emerging from highly application-oriented research, dispersed
research communities worked on specific solutions using the repertoire and stan-
dards of their specific fields. The requirements of visual analytics introduce new
dependencies between these fields.
Search WWH ::

Custom Search