Environmental Engineering Reference
In-Depth Information
Contribuon on Carbon Emission in China
50.00%
41.70%
40.00%
30.00%
20.00%
10.00%
4.70%
3.10%
2.40%
0.20%
0.00%
-0.20%
-0.10%
-0.60%
-0.70%
-1.50%
-1.10%
-2.00%
-10.00%
-20.00%
-19.80%
-30.00%
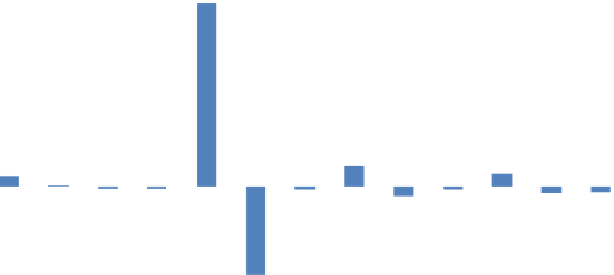
Fig. 2.18
Contributions of carbon emission by sector from 2005 to 2009
than the per capita GDP of the primary industry (0.2 %), per capita GDP of the
tertiary industry (4.7 %), and per capita income (3.1 %).
Energy intensity improvements by individual industrial sectors played a positive
role on carbon intensity reductions during the 11th FYP period, among which, the
energy intensity of GDP from the secondary industry played the biggest role with its
contribution at 19.8 %.
Renewable energy has developed dramatically. The annual growth rate of
renewable energy consumed was about 10.5 %, which is higher than the average
growth rate of total energy consumption.
However due to a relative lower base of renewable energy consumption, the
optimization of the energy consumption structure played only a slight role in
slowing down the growth rate of carbon emissions.
Looking at the contribution from energy consumption structural adjustment, the
impact was not significant during the first 4 years of the 11th FYP; it is shown in
Fig.
4.18
that the carbon intensity improvement of energy consumption in the
primary, secondary and tertiary industry only contributed
0.1 %,
0.7 % and
0.6 % for carbon emissions.