Environmental Engineering Reference
In-Depth Information
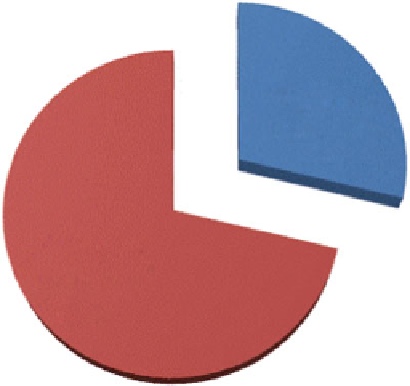
Fig. 2.11
Contributors for
energy-savings during the
period of the 11th FYP
11 th FYP (2006-2010)
Energy-saving
through strucuture
adjustment
28.8%
Energy-saving
through technical
improvement
71.2%
Table 2.5
Energy-savings and its contributions from structure change during 11th FYP
Energy-savings (Mtce) Contribution rate (%)
Industrial structure 1,451 7.9
Internal secondary industrial structure 4,896 26.6
Internal tertiary industrial structure 5,441 29.6
Internal industry sector structure 2,065 11.2
Internal industry subsector structure 4,538 24.7
Total 18,392 100
Note: The industrial structure is the mix of primary, secondary and tertiary; the internal secondary
industrial structure is the mix of industrial sector and construction sector; the internal tertiary
industrial sector structure is the mix of transportation, commercial and other service; the internal
industry sector structure is the mix of 39 subsectors
Analyzing the energy-savings contribution by sector shows that the industrial
sector played a key role in realizing the energy-savings target for the 11th FYP.
According to research results by ERI, accumulated energy-savings from the
industrial sector amounted to 372 Mtce, a share of 58.3 %, while the structural
adjustment, the commercial and residential sector, and the agriculture and construc-
tion sector contributed 18.5 %, 18.9 % and 5.2 %, respectively (Table
2.6
).
Since the boom of the domestic auto market during the 11th FYP (see Fig.
2.13
),
road transportation fuel consumption, especially fuel use from the private car has
increased dramatically. The annual growth rate of private car petroleum use grew
by 16.4 % during the 10th FYP (see Table
2.7
), 5.2% higher of GDP growth rate.
Energy use from other transportation modes, which includes air transportation, also
increased very quickly.


