Environmental Engineering Reference
In-Depth Information
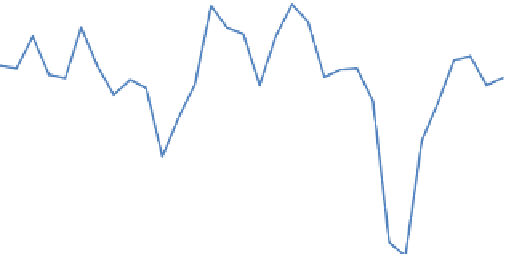
10.00%
8.00%
6.00%
5.02%
4.05%
4.00%
2.00%
0.68%
0.00%
-2.00%
-4.00%
-6.00%
-8.00%
Fig. 2.10
Annual energy intensity improvement from 1979 to 2010 (Source: China Energy
Statistical Yearbook [
2
])
Table 2.4
Comparison of target and current status for 11th FYP
11th FYP target
Reality
Annual growth rate of GDP (%)
7.5 %
11.2 %
GDP in 2005 (trillion RMB )
18.49
18.49
Energy intensity in 2005 (tce/10k RMB )
1.276
1.276
Improvement rate of energy intensity (%)
20
18.96
GDP in 2010 (based on 2005 constant price, trillion RMB Yuan)
26.55
31.46
Energy intensity in 2010 (tce/10k RMB Yuan)
1.021
1.033
Total fixed energy-savings (Mtce)
678
765
2.2.2 Methodology on Potential Energy-Savings Analysis
The potential energy-savings is based on the improvement of energy intensity of
GDP or energy consumption per unit GDP, which is the ratio of energy consump-
tion to GDP.
5
Various factors can affect energy intensity, including economic and social
factors, as well as the energy consumption structure and local condition such as
climate and land area [
6
].
Many incomparable elements could impact energy intensity among different
countries and regions due to a different economic development phase, energy
consumption structure, natural conditions and even the foreign exchange rate.
Two approaches could be taken to improve energy efficiency or energy
savings—structure optimization and technical improvements.
5
Dai, Yande. et al. [
5
].