Environmental Engineering Reference
In-Depth Information
100%
90%
80%
70%
60%
50%
40%
30%
20%
10%
0%
2005
2006
2007
2008
2009
2010
Primary Electricity
7.4
7.5
7.8
8.6
8.7
9.4
Natural Gas
3
3.4
3.7
4.1
4.1
4.2
Oil
12
11.3
10.8
10.5
9.9
9.8
Crude coal
77.6
77.8
77.7
76.8
77.3
76.6
Fig. 2.3
Primary energy production structure for 11th FYP (Source: China Energy Statistical
Yearbook [
2
])
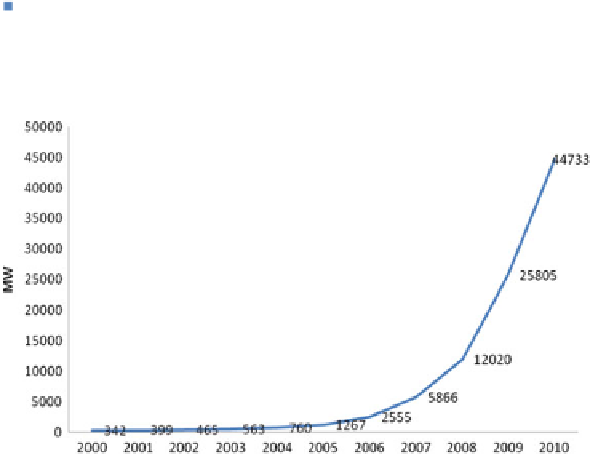
Fig. 2.4
The development of wind power in China (Source: China Wind Energy Association
(CWEA))
wind industry, it has become the largest country for installed wind capacity
(see Fig.
2.4
).
According to statistical data from the China Electricity Council, wind power
capacity connected to the power grid has reached 31 MW.
However, to slow down carbon emissions of carbon, more efficient energy has
been consumed to decrease the coal share in primary energy consumption structure.
The nation has imported more than half of its total oil consumption, which
accounts for 19.0 % of primary energy consumption in 2010, 9.2 % age points more
than its share of primary energy production (see Fig.
2.5
).