Environmental Engineering Reference
In-Depth Information
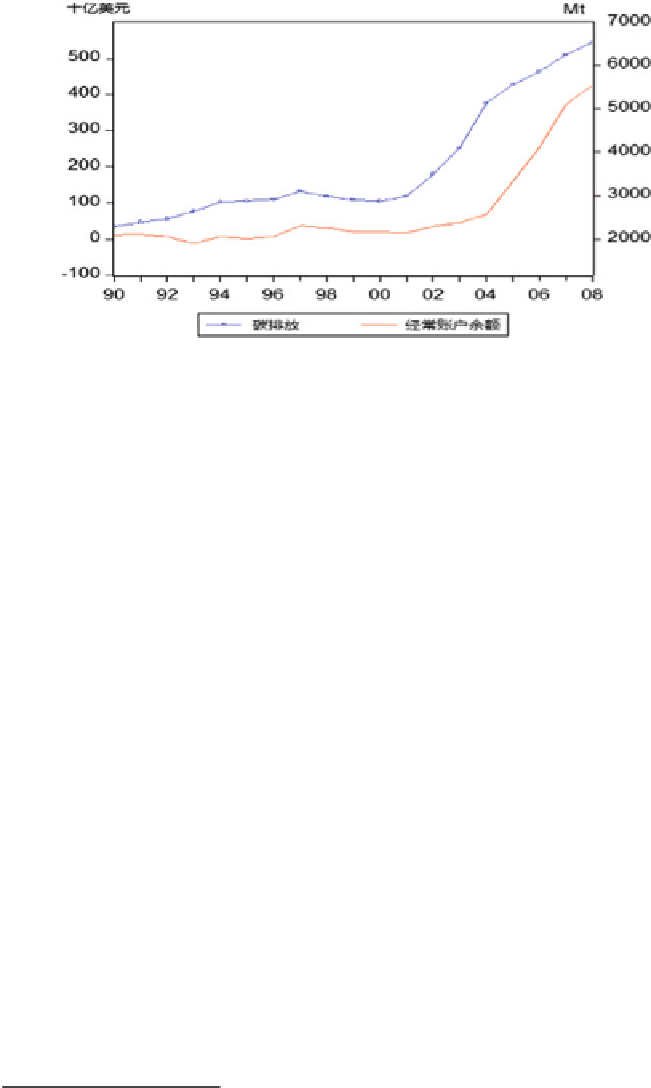
Fig. 9.1
China's carbon emission and trade surplus growth
high. According to the Japanese Finance Ministry,
6
in the fiscal year of 2007 (April
2006-March 2007), the trade value between China and Japan surpassed the trade
value between China and United States for the first time, and China became Japan's
largest trading partner since World War II. In 2010, China-Japan trade volumes
reached 297.77 billion U.S. dollars, accounting for 10.02 % of the trade value
between China and other countries.
7
Third, intra-industry trade between China and
Japan is expanding, and intra-industry trade of carbon intensive products such as
mineral products and cement is deepening. We also focus on the increase in exports
of China's carbon intensive products to Japan.
9.2
Literature Review
Since the 1990s, a growing body of literature has focused on the influence of
trade on a country's CO
2
emissions. Studies about the correlation between trade
and CO
2
emissions mainly concentrate on three levels: Evaluating the amount of
CO
2
emissions caused by trade [
1
-
7
,
8
], studying the transfer of carbon intensive
industries in the process of international trade [
9
-
12
], and analyzing the relation-
ship between trade structure and CO
2
emissions [
13
-
18
].
This paper calculates the carbon intensity of the main traded goods between
China and Japan by using the latest input-output tables. To analyze the specific
relationship between the competitiveness of these two countries, trade mode and
carbon intensity, we use panel data and introduce industrial variables into the
model. We also find the evidences for the carbon intensive industry relocation by
monitoring the changes of sector level trade data between China and Japan. We find
7
Source: China Economic Information Network Statistical Database