Information Technology Reference
In-Depth Information
down to examine details on the information in question. These drilldown
presentations include dynamic and interactive representations of current
and historical information. For example, a user or administrator can easily
determine the number of jobs running or queued on every system of any
available grid; the amount of data being added or removed from nodes on
a grid; as well as a wealth of current and historical information pertaining
to the individual nodes, grids, or virtual organizations on an available grid.
Our work contributes to the widespread monitoring initiative in the dis-
tributed computing community that includes NetLogger (Tierney et al.,
1998), GridRM (Baker and Smith, 2002), Ganglia (Massie et al., 2004), and
Network Weather Service (Wolski et al., 1999) to name a few.
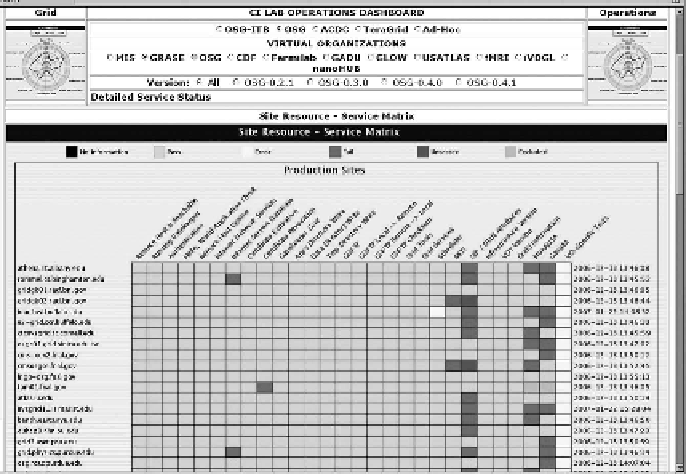
Our grid operations dashboard, which can be found at http://osg.ccr.
buffalo.edu/operations-dashboard.php, was designed to provide dis-
covery, diagnosis, and the opportunity for rapid publication and repair
of critical issues to grid administrators (see Figure 2.3). The operational
status of a given resource is determined by its ability to support a wide
variety of grid services, which are typically referred to as “site functional
tests”
(Prescott, 2005). Tests are performed regularly and sequentially in
order to verify an ever more complex set of services on a node. These
results are reported in our operations dashboard in an easy-to-read
chart.
FIGURE 2.3
The operations dashboard shows the status of nodes on a selected grid or for
a given virtual organization.
Search WWH ::

Custom Search